September 26th, 2011 | 8 Comments
If you have not only some data points or a line to plot but a whole matrix, you could plot its values using different colors as shown in the example plot in Fig. 1. Here a 2D slice of the 3D modulation transfer function of a digital breast tomosynthesis system is presented, thanks to Nicholas Marshall from UZ Gasthuisberg (Leuven) for sharing the data.
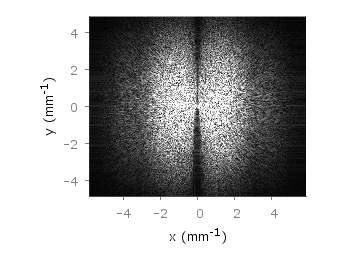
Fig. 1 A simple color map (code to produce this figure, data)
All we need to create such a plot is the image plot style, and of course the data have to be in a proper format. Suppose the following matrix which represents z-values of a measurement.
0 1 2 3 4 3 2 1 0
0 1 2 3 4 3 2 1 0
0 1 2 3 4 3 2 1 0
0 1 2 3 4 3 2 1 0
0 1 2 3 4 3 2 1 0
0 1 2 3 4 3 2 1 0
0 1 2 3 4 3 2 1 0
0 1 2 3 4 3 2 1 0
0 1 2 3 4 3 2 1 0
In order to plot these values in different gray color tones, we specify the corresponding palette. In addition we apply the above mentioned image plot style and the matrix format option. The result is shown in Fig. 2.
set palette grey
plot 'color_map.dat' matrix with image
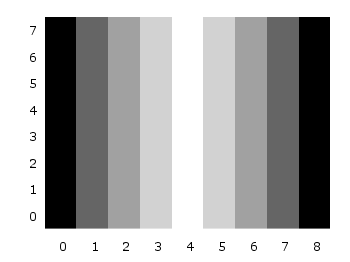
Fig. 2 A simple color map (code to produce this figure, data)
One remaining problem with Fig. 2 is, that the values on the x- and y-axis are probably not the one which you want, but the corresponding row and column numbers. One way to get the desired values is the use command, which can also be used with image. See Fig. 3 for the result.
plot 'color_map.dat' u (($1-4)/10):2:3 matrix w image
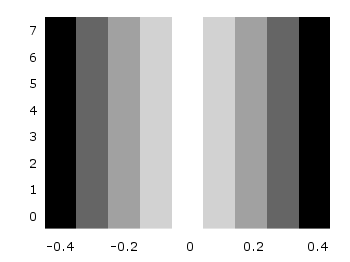
Fig. 3 A color map with a scaled x-axis (code to produce this figure, data)
Another way is to store the axes vectors together with the data. Therefore the data has to be stored as a binary matrix. The format of this matrix has to be the following:
<M>  <y1>   <y2>   <y3>   ... <yN>
<x1> <z1,1> <z1,2> <z1,3> ... <z1,N>
<x2> <z2,1> <z2,2> <z2,3> ... <z2,N>
 :      :      :      :   ...    :
<xM> <zM,1> <zM,2> <zM,3> ... <zM,N>
In Matlab/Octave the binary matrix can be stored using this m-file. The stored binary matrix can then be plotted by adding the binary indicator to the plot command.
plot 'color_map.bin' binary matrix with image
Note that in principle a color map can also be created by the splot command:
set pm3d map
splot 'data.dat' matrix
But if you create vector graphics with this command you will get a really big output file, because every single point will be drawn separately. For example check the graph from Fig. 1 as pdf created with plot and image and as pdf created with splot and pm3d map.
Hi all,
I am investigating a way to use Gnuplot to show binary output files from the GPRMax2D ground penetrating radar simulator. The binary output is well documented and consists of a header and “rows” of data = each trace consist of the number of samples. I can read the number of traces and samples, but I do not know how to instruct Gnuplot to read this particular file and draw an image out of it. Basically it should be something like skip the header, draw a matrix consisting of Ntraces X Sample values with image – but I just do not get it.
I am sure that it can be done since I can achieve it through Octave and a borrowed Matlab script, but I do not see what is happening because the Octave pipes the data directly to Gnuplot.
A more direct help/instructions would be appreciated, but I will be satisfied with the answers to the next two questions:
Is there some good instructions on how to do this reading/drawing binary files? I find the info in wiki/manual/examples lacking detailed explanation and hard to understand.
How can I “teach” Gnuplot to recognize this particular file and automatically read the size of the matrix (this is available in the header of the file) – I’ve seen that it recognizes some binary files by default and knows how to draw them which would be my end goal.
Hi Goran,
at the moment I don’t know if it is possible to extract the size of the matrix from the header directly with gnuplot. I used only very simple binary data so far. But all possible commands should be described under the binary section of the manual. The
skipcommand can be used to skip the header if you know its size.If you still have problems to figure things out, you could sent me an example data file you like to plot.
Hi hagen,
you have pointed me out to my frustration…. Yes the manual does gives the list of all the commands, but I can not figure out how to use them properly to get the output – the problem lies in me more than in gnuplot.
As for the ability to get some info from the header or not, I would be willing to extract the info in a “preprocessing” of the file, but there must be a way to use the binary matrix directly and I just do not see how….
Please check this link for an example file (bre1.out) that I would like to present with gnuplot:
https://www.dropbox.com/s/vb0v94r9u70gc19/GPRMax2D%20example.zip.
In the zip I have also added the screenshot from Octave (using gnuplot backend), used matlab scripts ( I do not know if they are in any way relevant to you) and the gnuplotstream.plt file created by Octave piping the file.
Do you have any pointers to some examples on how to draw/manipulate binary data with gnuplot? I checked the ones in the main page and the manual, but they are either too simplistic or lacking the detailed explanation on what exactly is happening when a certain command is used.
I guess that I am searching for a tutorial that gives very distinct instructions like:
1. This is the structure of the binary data we will use Header+ data
2. We use these settings to prepare the gnuplot scene for the data
3. We will read/skip/do something to header because we want this, this and this
4. we will read the binary data as matrix/array/record (these are the confusing ones for me)
5 we draw it by using plot (image) or splot – when to use what?
I hope that this would give me the possibility to follow and understand what and when to do to get a desirable result…
Thank you in advance!
Hi hagen,
I managed to chop and clean the Octave piping output to show the file as good as I can in Gnuplot. It is not bad, but so far I only managed to get it to work with “with image” option. In that way I can not read/show the amplitude information in the statusbar because “z” value gets transfered into color coding of the “image”. I have written a small *.plt preprocessor for my *.out files so I get them on the fly.
I now have only two questions left:
1. How to make it work with splot? Any suggestions would be appreciated.
2. My script preprocessor can write the file and run the gnuplot from command prompt, but I am having trouble giving it the full path to the file – it always complains about not allowed characters. I read somewhere that gnuplot uses slash instead of backslash, but have not managed to get it to work no matter what I try. Any suggestions?
here is the example script that works fine if I keep the plt in the same folder as my binary file:
Hi Goran.
Good to see that you finally managed to get the binary file to work. I know that it is hard work in most cases. Regarding your questions:
1) it should directly work with
splotby just omittingwith imageand replacingplotwithsplot. You can have a look at this example. But note that plot is much faster if you have a lot of points. I didn’t completely understood why the image plot is not appropriate. Maybe you just post the figure if you are finished with it.2) I did not completely got it. Has octave problems calling gnuplot? Because there is no call to a *.plt script in the gnuplot file. What I would maybe try is to use
'/path/file.plt'instead of"/path/file.plt".Hi hagen,
first about the Octave misunderstanding. Short answer is: No Octave has no problem piping file to gnuplot. Long answer: The author of the GPRMax2D (software that builds the binary files I wish to represent) was using Matlab to visualize the outputs and has shared the *.m files to achieve this with the program. Now since Matlab is too expensive for a lot of people, I tried to find the substitute and found out that Octave can use the original *.m files to show the files… and it uses gnuplot as a backend to achieve it. So I decided to skip the need for Octave and seeing a few warnings when using original *.m files – I will make it work directly with gnuplot. Although the decision was easy, figuring out all of the tics, scaling and binary matrix data settings was too much for me, but I found a temporary file that Octave uses and started from there. Octave pipes the instructions and the file points (after reading from binary form) to gnuplot so I could not just use that file for every *.out. When I wrote my preprocessor the idea was to have the path of the file and store the *.plt anywhere on my computer. However, that did not work – if the path was inside *.plt the gnuplot script stops in step one (not allowed character in file parameter). I am keeping the plt and out file together in the same folder now so it works, but I feel that I am missing some simple piece of info here to make it work with paths as well.
About still not figuring out splot:
For an example, my binary data is consisting of 115 “rows” of EM field amplitudes (%float%float%float stands for 3 parts of it, but I only show the first value), each “row” has 2036 values (triplets). I tried to use splot first, but the “rows” in binary form are not separated with blank lines so it complained when using PM3D. I tried d3grid before sploting, but it did not work ( and on a few occasions froze the old desktop I was working on), if I remember correct complained about not allowing to grid color value…. I just do not get it, how am I suppose to instruct the splot so it “sees” the data “the same way” as plot.
It is not bad showing it with Image (I do like the speed now), but I can only show X and Y positions and the actual amplitudes get “changed” by cbrange into colors so I do not see how to read the value with mousing options.
I would be happy to share the binary file with description of the fields, resulting plot script and images to make a more verbose instruction for someone else. Keep in mind that my resulting plt is a result of chopping the original octave output script, so I still do not fully understand some of the settings, but I figured out when they provide my expected result. What would be the best way to provide you with the data example+ plot script+ image result + my attempt on explaining what I have and why I did what?
For the quick look of the output you can go here: http://gpr-forum.com/viewtopic.php?f=3&t=9914
thank you for the encouragement and sorry for the long rant…
Hi Goran.
The problem with the data format as matrix without blank line and splot should be fixable by telling splot exactly this:
hi hagen,
I do not think I can use matrix directly because ( as said in manual):
“For binary input data, the first element of the first row must contain the number of data columns.”
I can read the value of columns ( and rows) from different place in the header of my file, but I can not force it to matrix command. That is why I used array – to define number of rows and columns + dx and dy to define step for coordinates that are generated and then color (z) value is read as the value at (row, column).