May 21st, 2013 | 1 Comment
As you may have noted, gnuplot and Matlab have different default color maps. Designing such a default map is not easy, because they should handle a lot of different things (Moreland, 2009):
– The map yields images that are aesthetically pleasing
– The map has a maximal perceptual resolution
– Interference with the shading of 3D surfaces is minimal
– The map is not sensitive to vision deficiencies
– The order of the colors should be intuitively the same for all people
– The perceptual interpolation matches the underlying scalars of the map
In his paper Moreland developed a new default color map that was mentioned already in a user comment. In Fig. 1 the map is used to replot the photoluminescence yield plotted in an earlier entry.
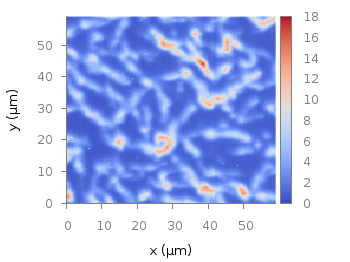
Fig. 1 Photoluminescence yield plotted with the default color map after Moreland, 2009 (code to produce this figure, data)
To use the default color map proposed by Moreland, just download default.plt and store it to a path, that is available to gnuplot. For example store it under /home/username/.gnuplotting/default.plt and add the following line to your .gnuplot file.
set loadpath "/home/username/.gnuplotting"
After that you can just load the palette before your plot command via
load 'default.plt'
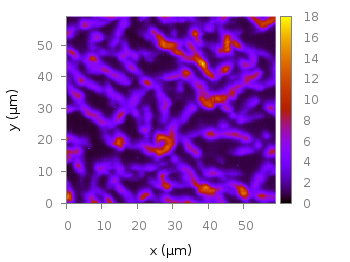
Fig. 2 Photoluminescence yield plotted with gnuplots default color palette (code to produce this figure, data)
In Fig. 2 the same plot is shown using the default color map from gnuplot, which is a little bit dark in my opinion.
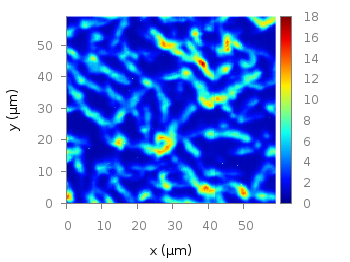
Fig. 3 Photoluminescence yield plotted with Matlabs default color palette (code to produce this figure, data)
Figure 3 shows the jet color map from Matlab, which is a classical rainbow map with all its pros and cons.
Pretty nice. Generally, the x and y axes are not the same parameters. e.g. x is time, y is height, and the value is temperature. So how to plot this kind of color map? Thanks