February 6th, 2013 | 8 Comments
Maybe you all know the nice example of gnuplots transparent fill style. I have replotted it slightly modified in Fig. 1.
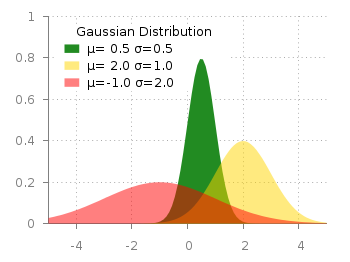
Fig. 1 Filledcurves with transparency settings as on the gnuplot demo site (code to reproduce this figure)
The interesting part in the code looks like this.
set style fill transparent solid 0.5 noborder
plot d1(x) fs solid 1.0 lc rgb "forest-green" title 'µ= 0.5 σ=0.5', \
     d2(x) lc rgb "gold" title 'µ= 2.0 σ=1.0', \
     d3(x) lc rgb "red" title 'µ=-1.0 σ=2.0'
The set style command sets the fill style to 50% transparency, which is overwritten by the explicit fs option to the first plotting command in order to plot the green curve without transparency.
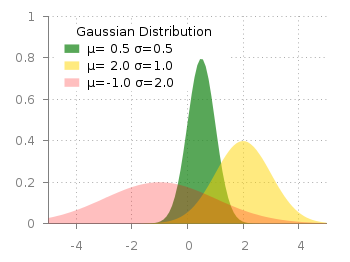
Fig. 2 Filledcurves with different transparency settings (code to reproduce this figure)
Now the question is how to plot filled curves with different transparency settings? The simple answer is, by just using this explicit fs plot argument. The result is shown in Fig.2 and can be reached with the following code. Now we apply a transparency of 75%, 50%, and 25% going from the green to the red curve.
set style fill noborder
plot d1(x) fs transparent solid 0.75 lc rgb "forest-green" \
        title 'µ= 0.5σ=0.5', \
     d2(x) fs transparent solid 0.50 lc rgb "gold" \
        title 'µ= 2.0 σ=1.0', \
     d3(x) fs transparent solid 0.25 lc rgb "red" \
        title 'µ=-1.0 σ=2.0'
How can I use fill style with epslatex terminal ? Which packages are needed ? Thank you.
You can use fill style with
epslatex, but transparency will not work. There are some claims that transparency is working with postscript, but I never managed to get it to work. If you really need transparency you could try thepdfcairooutput which gives you an identical results to thepngcairoterminal used in this post.I want to draw the area between f(x), g(x) et k(x)
f(x)=1125*x
g(x)=350*x
k(x)=-37.5*x+4650
plot [0:40][0:6000]f(x), g(x), k(x)
Do any one can suggest me that how to make filled curves transparent in eps format
This is just a quick “Thank you” for providing this website.
I regularly take a look at your blog when having some kind of a problem with gnuplot.
Thanks to your “code to reproduce this figure” examples, I almost always find a hint to help myself afterwards.
With gnuplot 5.0 out and the last entry in your blog being quite some time ago, I can only hope that you plan to continue this blog in the future.
Thanks for your feedback, and don’t worry I will continue with the blog.
By the way, the last entry is only ten days old ;)
Ah well,
thats the problem with bookmarks, I guess.
On the other hand: It does show that I do have your blog on my bookmark list for quite some time now.
Is there a way to use this with data from the two columns of a file like the command: ” plot ‘output.dat’ u 1:2 w l ” ?
I get an error at the fs argument…