March 5th, 2012 | 3 Comments
If you want to compare some time series of data with each other it could be a good idea to plot them just onto a grid without anything else. Here we will generate a scale paper like grid and plot two simple functions on it.
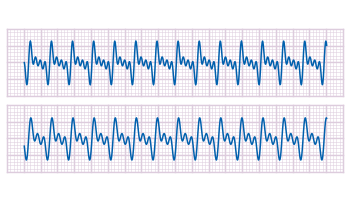
Fig. 1 Plotting some time data on scale paper like grid (code to produce this figure)
In Fig. 1, two harmonic tone complexes are shown, plotted within the multiplot environment. But the thing to consider here is the grid below them. In order to get such a grid, we have to remove all borders and tics. This is done by the following code.
set style line 11 lc rgb '#ffffff' lt 1
set border 0 back ls 11
set tics out nomirror scale 0,0.001
set format ''
The second number of scale for the tics corresponds to the minor tics and must be greater than zero, otherwise no minor tics will appear.
In the last step we enable minor tics on both axes, set the style for the grid and define the grid itself.
set mxtics
set mytics
set style line 12 lc rgb '#ddccdd' lt 1 lw 1.5
set style line 13 lc rgb '#ddccdd' lt 1 lw 0.5
set grid xtics mxtics ytics mytics back ls 12, ls 13
Great! You always solve my doubts.
you are missing a comma between the two line styles in ‘set grid’
Thank you, you are absolutely right. I have fixed it.