December 18th, 2011 | 12 Comments
In physics equipotential lines describe lines in space which are at the same potential, for example of the electric field.
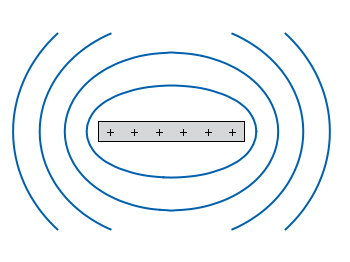
Fig. 1 Equipotential lines of a plate with electric charges (code to produce this figure)
In Fig. 1 equipotential lines for the electric field of six charges equally spaced on a plate are shown. In order to get these lines we need the function of the potential v(x,y) and make a contour plot with splot to a file to save the positions of the lines.
# calculate and save equipotential lines
set view map
unset surface
set contour base
# distance between contour lines according to 1/r
# => equal distance between lines
set cntrparam levels discrete 4,5,6.67,10
set isosam 31,31
set table 'equipotential_lines.txt'
splot v(x,y) w l ls 1
unset table

plot 'equipotential_lines.txt' u 1:2 w l ls 1
The positions of the lines are given by the cntrparam levels which are chosen in a way, to get equally spaced lines in the far field. The set table command stores the contour lines to a file, and finally the last command plots the stored lines.
In addition to the equipotential lines the value of the contour is stored as a third column in the equipotential_lines.txt file and can be plotted on the graph, too. This is shown in Fig. 2.
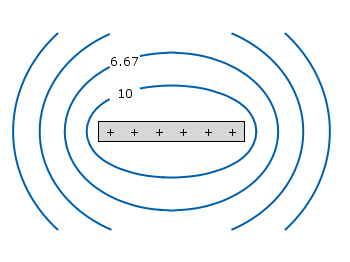
Fig. 2 Equipotential lines of a plate with electric charges with labels (code to produce this figure)
To get the label of the contour we have to choose a x-position which is given by lx0 in the following. The labels(x,y) function sets a string to the value of the third column, if the right x-position is given and we are above the plate. The function f(x,y) checks if we are near the point where a label should be drawn and undefines the contour line around this point. The size of this area is given by eps.
lx0 = 1.14899
eps = 0.15
labels(x,y) = (x==lx0 && y>y0) ? stringcolumn(3) : ""
f(x,y) = (abs(lx0-x)<eps && y>y0) ? 1/0 : y
no use
no use you didnot known the equipotential.
The way you put the labels in the levels is by far the easiest and more direct solution to this problem. This can be done with a pm3d map/splot too. This was very helpful. Thank you very much
Alas, something seems to have changed in gnuplot, since now the labels(x,y) function produces error “stringcolumn() called from invalid context” whenever I try to use it. Unless I’m doing something wrong:)
Thanks for the article anyway!
Hi Wojtek,
interesting, what version of gnuplot do you running?
I use version 4.6 patchlevel 0 and everything works fine.
Hi,
Is there a way of adding arbitrary text labels, say from a text file? I want to plot a series of height profiles for a gravity current at various time intervals, and label each profile with the corresponding time.
Thanks for your help.
Dai
I think I’ve just figured out a way to answer my own question – I just have to reorgainise my data so that it looks like the table output in “equipotential_lines.txt” and use the plot function at the end of the example file.
Hi Dai,
another example of the plotting style
labelscan be found here:http://www.gnuplotting.org/us-states-and-election-results/
Several times I looked here for help and inspiration, but this is the second time (http://www.gnuplotting.org/attractive-plots/) that I’m commenting to you. Great, great work Hagen.
Well, something curious. Try adding
to equipotential_lines2.gnu for example. These axes-aesthetic commands damage the generation of the equipotential lines points and “break” the smoothness of the equipotential lines!
Any idea to circumvent this issue?
Greetings from BA
I guess you mean something like this:
Fig. 3 Equipotential lines of a plate with electric charges with labels. The data was formated with
"%.1f". (code to produce this figure)If you specify the
"%.1f"format before theset tablecommand your data inequipotential_lines.txtwill change and be cut after the first decimal place. That is the reason while it no longer looks smooth.Exactly. Thanks!
Hi, what can we do if we have already all values for x,y and the potencial and we want to input in gnuplot as equipotencial lines instead of “degradation” of the potencial?
Thanks