August 13th, 2010 | 7 Comments
In Gnuplot it is easy to define a continuous and differentiable function such as f(x) = x, but what to do if we need a function that fulfill non of these conditions?
For example let us consider a step function. Typically a step function is given by
           / 1   if x > a
step(x) = -|
           \ 0   else
In Gnuplot this can be achieved by using the ternary operator:
step(x) = x>a ? 1 : 0
Which is a simple if-else statement and means step(x)=1 if x>a else step(x)=0.
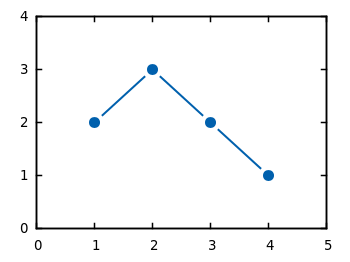
If we plot this function we get Fig. 1.
Fig. 1 Continuous plot of the step function (code to produce this figure)
As you can see this will result in a continuous plot. If we want a discontinuity in the plot, we have to create two separate functions that are only piecewise defined. This can be achieved by using 1/0 that will result in a undefined value.
f(x) = x<a  ? 1 : 1/0
g(x) = x>=a ? 1 : 1/0
Plotting both functions will result in Fig. 2.
Fig. 2 Discontinuous plot of the step function (code to produce this figure)
The ternary operator can also be used in an iterative way. For example if we want to define a rectangular function that is given by
           / 0     if abs(x) > 0.5
rect(x) = -| 0.5   if abs(x) = 0.5
           \ 1     if abs(x) < 0.5
we can use the following statement in Gnuplot to define it:
rect(x) = abs(x)>0.5 ? 0 : abs(x)<0.5 ? 1 : 0.5
In Fig. 3 you can see a plot of this function. To produce the sharp edges of the rectangular function we use a higher number of sampling points (also in Fig. 1 for the step function). In order to plot a function Gnuplot calculates 100 points of the given function and draw a line through them. This can be set to another value with the set samples <value> command.
Fig. 3 Plot of the above defined rect(x) function (code to produce this figure)