Gnuplotting

Create scientific plots using gnuplot

April 16th, 2014 | 17 Comments

Gnuplot comes with the possibility of plotting histograms, but this requires that the data in the individual bins was already calculated. Here, we start with an one dimensional set of data that we want to count and plot as an histogram, similar to the hist() function we find in Octave.

Histogram of angle data

Fig. 1 Two different distributions of measured angles. (code to produce this figure, hist.fct, data)

In Fig. 1 you see two different distributions of measured angles. They were both given as one dimensional data and plotted with a defined macro that is doing the histogram calculation. The macro is defined in an additional file hist.fct and loaded before the plotting command.

binwidth = 4
binstart = -100
load 'hist.fct'
plot 'histogram.txt' i 0 @hist ls 1,\
     ''              i 1 @hist ls 2

The content of hist.fct, including the definition of @hist looks like this

# set width of single bins in histogram
set boxwidth 0.9*binwidth
# set fill style of bins
set style fill solid 0.5
# define macro for plotting the histogram
hist = 'u (binwidth*(floor(($1-binstart)/binwidth)+0.5)+binstart):(1.0) smooth freq w boxes'

For a detailed discussion on why @hist calculates a histogram you should have a look at this discussion and the documentation about the smooth freq which basically counts points with the same x-value. The other settings in the file define the width of a single bin plotted as a box and its fill style.

Histogram of angle data

Fig. 2 Two different distributions of measured angles. The bins of the histograms are shifted to be centered around 0°. (code to produce this figure, hist.fct, data)

It is important that the two values binwidth and binstart are defined before loading the hist.fct file. These define the width of the single bins and at what position the left border of a single bin should be positioned. For example, let us assume that we want to have the bins centered around 0° as shown in Fig. 2. This can be achieved by settings the binstart to half the binwidth:

binwidth = 4
binstart = -2
load 'hist.fct'
plot 'histogram.txt' i 0 @hist ls 1,\
     ''              i 1 @hist ls 2

January 5th, 2012 | 16 Comments

This time another colormap plot. If you are using Matlab or Octave you are probably be familiar with Matlabs nice default colormap jet.

Matlab colorbar

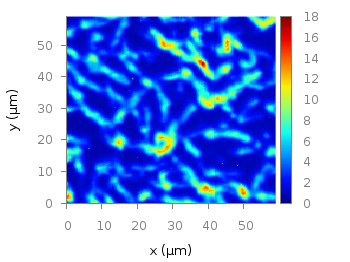
Fig. 1 Photoluminescence yield plotted with the jet colormap from Matlab (code to produce this figure, data)

In Fig.1, you see a photoluminescence yield in a given region, and as you can see Gnuplot is able to apply the jet colormap from Matlab. This can be achieved by defining the palette as follows.

set palette defined ( 0 '#000090',\
                      1 '#000fff',\
                      2 '#0090ff',\
                      3 '#0fffee',\
                      4 '#90ff70',\
                      5 '#ffee00',\
                      6 '#ff7000',\
                      7 '#ee0000',\
                      8 '#7f0000')

The numbers 0..8 are automatically rescaled to 0..1, which means you can employ arbitrary numbers here, only their difference counts.

If you want to use this colormap regularly, you can store it in the Gnuplot config file as a macro.

# ~/.gnuplot
set macros
MATLAB = "defined (0  0.0 0.0 0.5, \
                   1  0.0 0.0 1.0, \
                   2  0.0 0.5 1.0, \
                   3  0.0 1.0 1.0, \
                   4  0.5 1.0 0.5, \
                   5  1.0 1.0 0.0, \
                   6  1.0 0.5 0.0, \
                   7  1.0 0.0 0.0, \
                   8  0.5 0.0 0.0 )"

Here we defined the colors directly as rgb values in the range of 0..1, which can be alternatively used a color definition.
In order to apply the colormap, we now can simple write

set palette @MATLAB

April 19th, 2011 | 3 Comments

Often we use a specific line color or output terminal in Gnuplot. Or we are not satisfied with one of the default settings, for example the font used by the png terminal. There exists an easy way to fix these settings. Gnuplot reads a startup file, called .gnuplot under Linux and GNUPLOT.INI under Windows. First it searches the current directory and then your home directory after that file.

Here is an example of what is possible to include in the startup file.

# enable macros
set macros
# search for functions or data files in these directories
set loadpath '/usr/local/lib/gnuplot'
# add default line colors
set style line 1 lc rgb '#0060ad' lt 1 lw 2 pt 5   # blue
set style line 2 lc rgb '#dd181f' lt 1 lw 2 pt 7   # red
# add macros to select the desired line style
BLUE = "1"
RED = "2"
# add macros to select a desired terminal
WXT = "set terminal wxt size 350,262 enhanced font 'Verdana,10' \
   persist"
PNG = "set terminal pngcairo size 350,262 enhanced font 'Verdana,10'"
SVG = "set terminal svg size 350,262 fname \
   'Verdana, Helvetica, Arial, sans-serif' fsize = 10"

With these settings and the use of macros our plotting will become more easier. For example to plot the sinusoid from the plotting functions introduction we can now use the following code.

@WXT
[...]
plot f(x) title 'sin(x)' with lines ls @BLUE, \
     g(x) notitle with lines ls @RED

Note that you have to omit the usage of reset in your code, because it will clear the line style settings.

Sinusoid

Fig. 1 Plotting using the configuration file (code to produce this figure)

You can of course override the style settings of the configuration file.

plot f(x) title 'sin(x)' with lines ls @BLUE, \
     g(x) notitle with lines ls @RED lw 1
Sinusoid

Fig. 1 Overwriting settings from the configuration file (code to produce this figure)

October 27th, 2010 | 11 Comments

If we have more than one graph that should be displayed in a figure, the multiplot command is the one to use in Gnuplot. But as we will see this is not a trivial task.
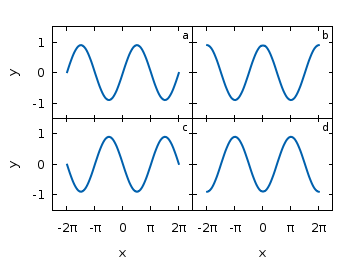
Let us consider we have four different functions that should be presented in the same figure as shown in Fig. 1.

nice multiplot

Fig. 1 A multiplot with reduced axes labeling and nicely arranged graphs (code to produce this figure)

The functions are given by:

# Functions (1/0 means not defined)
a = 0.9
f(x) = abs(x)<2*pi ? a*sin(x)           : 1/0
g(x) = abs(x)<2*pi ? a*sin(x+pi/2)      : 1/0
h(x) = abs(x)<2*pi ? a*sin(x+pi)        : 1/0
k(x) = abs(x)<2*pi ? a*sin(x+3.0/2*pi)  : 1/0

For an explanation of the used syntax to declare the functions have a look at the Defining piecewise functions article.

In a first attempt we just use the multiplot command:

### Start multiplot (2x2 layout)
set multiplot layout 2,2 rowsfirst
# --- GRAPH a
set label 1 'a' at graph 0.92,0.9 font ',8'
plot f(x) with lines ls 1
# --- GRAPH b
set label 1 'b' at graph 0.92,0.9 font ',8'
plot g(x) with lines ls 1
# --- GRAPH c
set label 1 'c' at graph 0.92,0.9 font ',8'
plot h(x) with lines ls 1
# --- GRAPH d
set label 1 'd' at graph 0.92,0.9 font ',8'
plot k(x) with lines ls 1
unset multiplot
### End multiplot

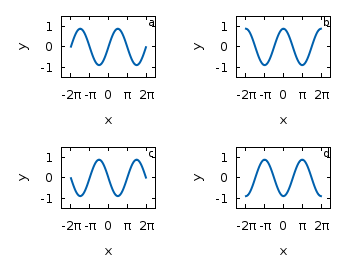
We also added a label to every graph in order to identify them easily in the figure. Note that we overwrite the label 1 for every graph. If we don’t do that, then on the last graph all four labels will be present. Using this simple approach we will get Fig. 2. As you can see this is not an ideal case to use the space in the figure. The xtics and the ytics are just the same in every graph and are not needed to be displayed on every graph.

simple multiplot

Fig. 2 A straightforward use of the multiplot command to plot four different functions (code to produce this figure)

But before we fix this we will introduce the use of macros in order to shorten the code a lot. As you can see in the code block above, the set label command contains the same position for every graph. We can shorten this by:

set macros
# Placement of the a,b,c,d labels in the graphs
POS = "at graph 0.92,0.9 font ',8'"
[...]
set label 1 'a' @POS
plot f(x) with lines ls 1

and so on for the other graphs.

But the macros are not only useful for the different labels, but also for the other settings of the multiplot.
First we want to remove the x/y-tics and labels, where they are not necessary. Here it is the same as with the label settings. Every graph uses the settings from the graph before, if we didn’t change these settings. In order to remove the xtics at a given graph we have to tell this explicitly. Therefore we define macros for the two cases label+tics vs. nolabel+notics:

# x- and ytics for each row resp. column
NOXTICS = "set xtics ('' -2*pi,'' -pi,'' 0,'' pi,'' 2*pi); \
          unset xlabel"
XTICS = "set xtics ('-2π' -2*pi,'-π' -pi,'0' 0,'π' pi,'2π' 2*pi);\
          set xlabel 'x'"
NOYTICS = "set format y ''; unset ylabel"
YTICS = "set format y '%.0f'; set ylabel 'y'"

These will then be used in the plotting section:

# --- GRAPH a
@NOXTICS; @YTICS
[...]
# --- GRAPH b
@NOXTICS; @NOYTICS
[...]
# --- GRAPH c
@XTICS; @YTICS
[...]
# --- GRAPH d
@XTICS; @NOYTICS

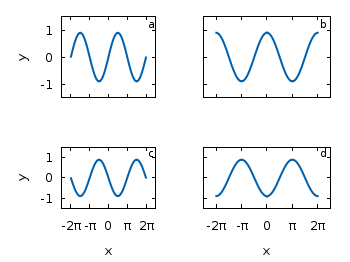
Applying the axes settings will result in Fig. 3.

multiplot

Fig. 3 A multiplot with reduced axes labeling (code to produce this figure)

Now the label etc. on the axes are done in a nice way, but the sizes and the spaces between the individual graphs are very bad. This comes from the fact that Gnuplot calculates the size of a graph depending on the presence of tics and labels. In order to have graphs with the same size and align them without spaces between them we have to set the margins of the individual graphs manually.

# Margins for each row resp. column
TMARGIN = "set tmargin at screen 0.90; set bmargin at screen 0.55"
BMARGIN = "set tmargin at screen 0.55; set bmargin at screen 0.20"
LMARGIN = "set lmargin at screen 0.15; set rmargin at screen 0.55"
RMARGIN = "set lmargin at screen 0.55; set rmargin at screen 0.95"

The trick is that we use the at screen command to arrange the margins absolutely in the figure. As you can see the bottom margin of the two figures in the top is placed at 0.55, the same value the top margin of the two lower graphs start.
These margins are then added in the same way to the multiplot command as the label settings and we get:

# --- GRAPH a
@TMARGIN; @LMARGIN
[...]
# --- GRAPH b
@TMARGIN; @RMARGIN
[...]
# --- GRAPH c
@BMARGIN; @LMARGIN
[...]
# --- GRAPH d
@BMARGIN; @RMARGIN

Having done all this we will finally get our desired figure which is shown in Fig. 1.