Gnuplotting

Create scientific plots using gnuplot

February 21st, 2014 | 5 Comments

For the measurement of distances T-shaped arrows are often used to highlight the length. In gnuplot there is an easy way to achieve this.

Diffraction on a slit

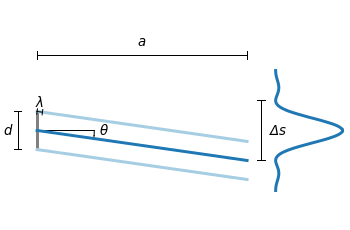
Fig. 1 Diffraction of light for a slit with the length d. (code to produce this figure)

Have a look at Fig. 1 which tries to explain the diffraction phenomenon of a slit with the length d. At a distance a the diffraction pattern is drawn. The different distances, the distance between the first minima of the diffraction pattern, and the wave length are indicated by T-shaped arrows. This kind of arrays can be achieved in gnuplot with the following code.

Theads = 'heads size 0.5,90 front ls 201'
set arrow from -24,-2 to -24, 2       @Theads
set arrow from -22, 2 to -21.44,1.92  @Theads
set arrow from 1.5,-pi to 1.5,pi      @Theads
set arrow from -22,2.5*pi to 0,2.5*pi @Theads

Here, 90 is the relevant entry after size as it describes the opening angle of the arrow head.
In addition, an open circle is drawn to indicate the angle θ. This is achieved by specifying the opening angle for the circle object.

set object circle at -22,0 size 6 arc [-8:0]

October 17th, 2012 | 5 Comments

Some data could be nicely visualized by representing them as arrows. For example, assume that we have done an experiment where we played something to a subject through three loudspeakers and the subject should name the direction where he or she perceived it. In Fig. 1 we show the named direction by the direction of the arrows. The color of the arrow indicates the deviation from the desired direction. A white and not visible arrow means no deviation and a dark red one a deviation of 40° or more.

Vector field showing localization data

Fig. 1 Vector field showing localization results. The arrows are pointing towards the direction the subject had named. The color indicates the deviation from the desired direction. (code to produce this figure, set_loudspeakers.gnu, data)

In gnuplot the with vectors command enables the arrows in the plot. It requires four parameters, x, y, dx, dy, where dx and dy controls the endpoint of the arrow as offset values to x,y. In our example the direction is stored as an angle, hence the following functions do the conversion to dx,dy. 0.1 defines the length of the arrows.

xf(phi) = 0.1*cos(phi/180.0*pi+pi/2)
yf(phi) = 0.1*sin(phi/180.0*pi+pi/2)

An optional fifth parameter controls the color of the vector together with the lc palette setting. The arrows start at x-dx,y-dy and point to x+dx,y+dy.

plot 'localization_data.txt' \
    u ($1-xf($3)):($2-yf($3)):(2*xf($3)):(2*yf($3)):4 \
    with vectors head size 0.1,20,60 filled lc palette