April 16th, 2014 | 17 Comments
Gnuplot comes with the possibility of plotting histograms, but this requires that the data in the individual bins was already calculated. Here, we start with an one dimensional set of data that we want to count and plot as an histogram, similar to the hist() function we find in Octave.
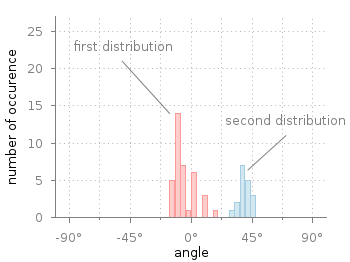
Fig. 1 Two different distributions of measured angles. (code to produce this figure, hist.fct, data)
In Fig. 1 you see two different distributions of measured angles. They were both given as one dimensional data and plotted with a defined macro that is doing the histogram calculation. The macro is defined in an additional file hist.fct and loaded before the plotting command.
binwidth = 4
binstart = -100
load 'hist.fct'
plot 'histogram.txt' i 0 @hist ls 1,\
     ''              i 1 @hist ls 2
The content of hist.fct, including the definition of @hist looks like this
# set width of single bins in histogram
set boxwidth 0.9*binwidth
# set fill style of bins
set style fill solid 0.5
# define macro for plotting the histogram
hist = 'u (binwidth*(floor(($1-binstart)/binwidth)+0.5)+binstart):(1.0) smooth freq w boxes'
For a detailed discussion on why @hist calculates a histogram you should have a look at this discussion and the documentation about the smooth freq which basically counts points with the same x-value. The other settings in the file define the width of a single bin plotted as a box and its fill style.
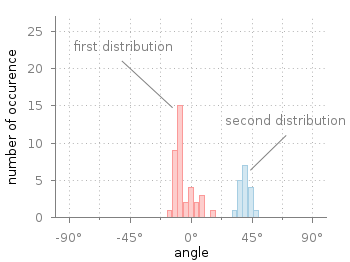
Fig. 2 Two different distributions of measured angles. The bins of the histograms are shifted to be centered around 0°. (code to produce this figure, hist.fct, data)
It is important that the two values binwidth and binstart are defined before loading the hist.fct file. These define the width of the single bins and at what position the left border of a single bin should be positioned. For example, let us assume that we want to have the bins centered around 0° as shown in Fig. 2. This can be achieved by settings the binstart to half the binwidth:
binwidth = 4
binstart = -2
load 'hist.fct'
plot 'histogram.txt' i 0 @hist ls 1,\
     ''              i 1 @hist ls 2
Thanks for doing all this tutorials man!
Hi,
This website is just awesome !!! You’ve done a great job. Thanks for that.
But i wonder how to draw a gaussian on the graph (by using a fit curve) with only an one dimensional set of data ?
Thanks.
Arthur
Hi Arthur.
It is possible, but complicated. You can not use smooth together with fit. Hence, we first need to store our data to a temporary file and fit them afterwards. The every command is used to ignore the last line in the hist.txt file, which is not needed. This will then result in Fig. 3 at the end.
# store data in a temporary file for fitting
set table 'hist.txt'
plot 'histogram.txt' i 0 @hist ls 1
unset table
# fit Gaussian
Gauss(x) = a/(sigma*sqrt(2*pi)) * exp( -(x-mu)**2 / (2*sigma**2) )
a = 30.
mu = 3.
sigma = 3.
fit Gauss(x) 'hist.txt' every ::0::7 u 1:2 via a,mu,sigma
# plot
plot 'hist.txt' every ::0::7 using 1:2 w boxes ls 1,\
     Gauss(x) w lines ls 2 lw 2
Fig. 3 Distributions of measured angles and a fitted Gaussian distribution. (code to produce this figure, hist.fct, data)
Hi,
Thanks a lot ! It is working very well. I didn’t know that it was possible to store the data. It will be very useful for my future plots.
I hope to see more amazing plots on your website, because I learned lots of things here.
Arthur
Your macro of course breaks down when plotting multiple, histograms with different binwidths or when you do exponential/logarithmic binning. Any nice ready-made solution for that?
I have some troubles with this histograms.
I have to write data on a file (because I have to make some curve fitting on part of this data), and what I get is the following file:
### beginning of gnuplot file
# Curve 0 of 1, 21 points
# Curve title: “name u (int(-log($4))):(1.)”
# x y xlow xhigh type
1 1 1 1 i
2 1 2 2 i
3 1 3 3 i
4 5 4 4 i
5 9 5 5 i
6 18 6 6 i
7 27 7 7 i
8 23 8 8 i
9 16 9 9 i
10 7 10 10 i
11 6 11 11 i
12 4 12 12 i
13 6 13 13 i
14 1 14 14 i
15 1 15 15 i
16 2 16 16 i
17 2 17 17 i
18 1 18 18 i
21 1 21 21 i
26 1 26 26 i
6 1 5.5 6.5 u
###EOF
I do not understand where this last line comes from. Any ideas?
PS: here are the files which have generated these frequancies:
https://dl.dropboxusercontent.com/u/10917026/toy.dat
https://dl.dropboxusercontent.com/u/10917026/stat.gp
Thanks for the article! I have another challenge, is it possible to plot multiple histograms with this method as stacked columns?
Thanks a lot for this code. One further question. How does one change the style to make the histogram colouring transparent?
Thanks for providing this script. It is very helpful.
I encountered a little problem when trying to plot a phase distribution in the range of -pi to pi. Easy copy & past will only work under the condition, that the number of bins has to be integer by the chosen binwidth. Otherwise you get artifacts (actual a bin to much at the right hand side).
I wrote a short improvement for such a chase:
#target binwidth
maxbinwidth = 0.25
#start point
binstart = -pi
#endpoint (rightmost edge of last bin)
binstopp = pi
#calculate number of bins (integer)
nobins = ceil( (binstopp-binstart)/maxbinwidth )
#actual binwidth
print ”
print ‘!!! ALERT !!!’
print nobins, ‘ bins with a width of ‘, binwidth, ‘ are used. This is a difference of ‘, binwidth-maxbinwidth, ‘ of target width.
print ”
then load hist-function.
Is it possible to get a the histogram as a spline(smooth line) instead of the bars?
Many thanks for your tutorial!!
However, could you please explain the meaning of these numbers?
“a = 30.
mu = 3.
sigma = 3.”
and “every ::0::7 u 1:2”
Thank you!
I found this tutorial without explaining how it works very difficult to follow. How looks like the content of histogram.txt? How do I make histogram if mine data file looks like
01.01.2018 23.471 24.441
02.01.2018 29.651 212.385
03.01.2018 30.619 137.066
04.01.2018 30.715 165.595
05.01.2018 30.571 216.187
06.01.2018 35.367 167.710
07.01.2018 30.742 129.912
08.01.2018 24.389 28.197
09.01.2018 30.499 186.371
10.01.2018 30.772 150.921
and I would like to plot two histograms from columns 2 and 3?
Great tutorial. I’m wondering if you can help me. I need to make a histogram with a poisson distribution fitted on it. I keep finding how to fit a Gaussian or binomial, but no Poisson.
Hi,
I have a data file consisting of single column having 1000 rows. I would like to plot normalized histogram and then would like to extract the middle point of each bar (x,y values of each) of the histogram. Next would like to fit with a user defined function those data. Would you please provide me the gnuplot script if possible?
Thanks.
This is clearly awesome but what about the overlapping data? Is there a way without fillings and without column line so that it looks something like steps? I know you can do it in PGPLOTS but that is very basic to follow.
something like: https://www.oreilly.com/openbook/cgi/figs/cgi0606.gif
This is clearly awesome but what about the overlapping data? Is there a way without fillings and without column line so that it looks something like steps? I know you can do it in PGPLOTS but that is very basic to follow. Something like: https://www.oreilly.com/openbook/cgi/figs/cgi0606.gif