March 15th, 2012 | 8 Comments
Suppose you have an image and wanted to add some lines, arrows, a scale or whatever to it. Of course you can do this easily with Gnuplot as you can see in Fig. 1.
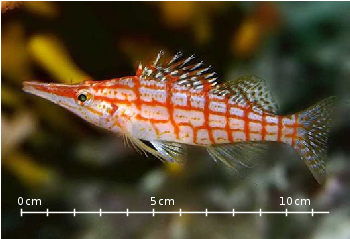
Fig. 1 Plotting a jpg image within your graph and adding a scale (code to produce this figure, image data). Image source: © SFTEP.
To plot the jpg image of the longnose hawkfish you have to tell the plot command that you have binary data, the filetype, and choose rgbimage as a plotting style. Also we ensure that the image axes are in the right relation to each other by setting ratio to -1.
set size ratio -1
plot 'fish.jpg' binary filetype=jpg with rgbimage
The scale needs a little more work, because Gnuplot can not plot a axis with tics to both directions of it. Hence we are using a bunch of arrows to achieve the same result. The text is than set by labels to the axis.
set arrow from 31,40 to 495,40 nohead front ls 1
set for [ii=0:11] arrow from 31+ii*40,35 to 31+ii*40,45 nohead \
   front ls 1
# set number and unit as different labels in order
# to get a smaller distance between them
set label '0'  at  25,57 front tc ls 1
set label 'cm' at  37,57 front tc ls 1
set label '5'  at 225,57 front tc ls 1
set label 'cm' at 237,57 front tc ls 1
set label '10' at 420,57 front tc ls 1
set label 'cm' at 442,57 front tc ls 1
Hello Again.
I am starting to get a pretty good hang of GNUplot. I am a student that is preparing a report using this program. I need to add an extra graphic to my report in addition to the main graph. I have tried to plot the image, but I recieve the error “GNUPLOT (plot_image): Number of pixels cannot be factored into integers matching grid. N = 1785 K = 26” What does this mean and how do I fix it? If it helps, I am running GNUplot version 4.2 and the image is in a .rgb format (version 4.2 doesn’t support .png or .jpg). Also, I have the postscript setup as color portrait enhanced and I want this second picture to be on the same page as my graph, but it CANNOT be within my main graph. It must be separate. If you could give me any help, I would really appreciate it!
Thanks
Liam
The error message means that you have 1785 data points, and gnuplot expects 26 points in a row. Unfortunately 1785 isn’t an integer multiple of 26. I suppose there is something wrong with your data file. Sometimes even a wrong encoding can cause such an error. Maybe you start with an easier file, as presented in this example.
Thanks.
But I don’t see how I can use the example you provided me. How could I convert a .png image to a binary or matrix format? Also, how would I determine the position of the image in relation to the main graph?
The easiest way would be to upgrade your gnuplot version. Otherwise you have to convert your data. If I remember correctly this could be done in gnuplot, but I have done it normaly in Matlab/Octave:
im = imread(filename,'png');
for ii = 1:size(im,1)
    for jj=1:size(im,2)
        A(jj,ii) = sum(im(ii,jj,:))/3;
    end
end
fid = fopen([filename(1:end-1) '.dat'],'w');
fwrite(fid,A(:),'uchar');
fclose(fid);
The position in relation to the image is then given by the pixel size of the image. For example, in the figure above the x-axes is set at a height of 40 pixels.
I just want to thank you, you are awesome, I am preparing a talk and this helped me to make my plots perfect.
Is it possible to add pdf files to gnuplot too?
[…] This post, which should be enough to show how images may make your Gnuplot charts more expressive, is just a beginning. First of all, who said that the numeric values in our example must be constant? You may certainly use that Gnuplot code as a template to fill each time with different origin and scaling values from a script. Even more important is the fact that nothing limits you to use graphics only as histogram bars. They may become illustrated captions or actual curve points, as in this more sophisticated example. You may even turn the whole concept upside down and use Gnuplot to better explain or describe images. To see what I mean, check out this picture of a longnose hawkfish with a Gnuplot scale. […]
Is it possible to make the background image transparent using gnuplot?