October 24th, 2013 | 4 Comments
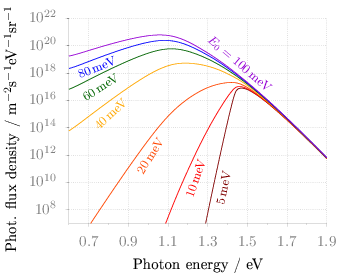
If you want to put labels into a graph using the epslatex terminal you are probably interested in using a smaller font for these labes than for the rest of the figure. An example is presented in Fig. 1.

Fig. 1 Photon flux density for different characteristic tail state energies E0 dependent on the photon energy. (code to produce this figure, data)
Figure 1 shows again the photon flux density from one of the last posts, but this time plotted with the epslatex terminal. The label size is changed by setting it to \footnotesize with the following code. First we introduce a abbreviation for the font size by adding a command definition to the header of our latex file.
set terminal epslatex size 9cm,7cm color colortext standalone header \
   "\\newcommand{\\ft}[0]{\\footnotesize}"
After the definition of the abbreviation we can use it for every label we are interested in.
set label 2 '\ft $5$\,meV'         at 1.38,4e9     rotate by  78.5 center tc ls 1
set label 3 '\ft $10$\,meV'        at 1.24,2e10    rotate by  71.8 center tc ls 2
set label 4 '\ft $20$\,meV'        at 1.01,9e11    rotate by  58.0 center tc ls 3
set label 5 '\ft $40$\,meV'        at 0.81,1e15    rotate by  43.0 center tc ls 4
set label 6 '\ft $60$\,meV'        at 0.76,9e16    rotate by  33.0 center tc ls 5
set label 7 '\ft $80$\,meV'        at 0.74,2.5e18  rotate by  22.0 center tc ls 6
set label 8 '\ft $E_0 = 100$\,meV' at 1.46,5e18    rotate by -40.5 center tc ls 7
Hi, thank you for this! I’m attempting something similar, and this helped, but I’m having a weird problem and was wondering if you could help.
I’m trying to set the axis numbers to a smaller font while keeping the label at the regular size. I’ve just been doing this via “set format y ‘\small%g'”, which has been working fine when I try it on the x axis, by for the y axis, the axis label disappears of the left of the plot! I know it’s still there, because when I move lmargin in to the middle of the page it reappears. Any ideas about this?
Hi Adam,
this is a known bug/feature of gnuplot that depends on the version of your gnuplot installation. gnuplot calculates the amount of space it needs from the actual length of the string you set. At least for the ylabel it works better in newer gnuplot version by identifying LaTeX commands which are not used for the calculation. For the format option I don’t know if it is the same.
What you can try is to define a shortcut for
\small, something like\newcommand{\sm}[0]{\small}in your LaTeX document and thenset format y '\sm %g'in your gnuplot code.In the ytics the exponent of 10 is nicely large. I figured out that using
set ytics format '$10${\large $^{%T}$}' offset 0.7,0works in my special case. But it would be nice with a solution that can do 0.1, 0.01, 0.001, 10^-4, 10^-5, … with those large nice exponents. Is there a good solution, or a better one than what i proposed?
Hi Jonatan.
I’m afraid there is no out of the box solution for your problem, but you can set the tics manually. For example
set ytics format '$%g$' offset 0.7,0
set ytics (0.1, 0.01, 0.001, '10${\large $^{-4}$}$\!' 0.0001)