May 20th, 2011 | 4 Comments
The tikz and epslatex terminal directly write text in the graph by using LaTeX. But if you want a line break within a label, a simple \\ will not work. In order to get a line break we can apply the \shortstack command.
set label '\shortstack{first line\\second line}'
In the following example, a principal component analysis (PCA) for attribute ratings of a listening test has been computed and the attributes together with the presented stimuli are plotted in the graph. The natural + little comb filter attribute and its counterpart included a line break (click on the figure for a larger version).
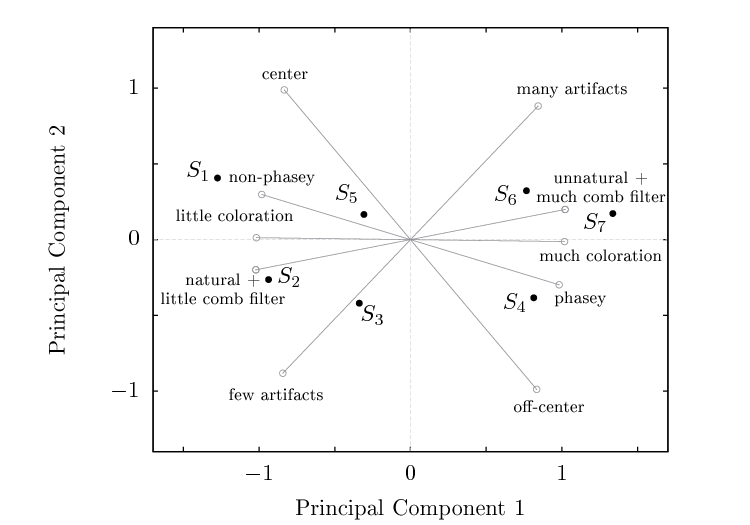
Fig. 1 A PCA plot with a line break in two of its attribute labels (click on the figure for a larger view, code to produce this figure)
Thanks so much – this was exactly what I was looking for and couldn’t seem to find elsewhere.
Much appreciated.
Would that solution work for long legend strings in key?? I am facing a problem with very long legend strings which I want to place with line breaks so they would not overlap the data lines.
Thanks
Hi Nilesh,
I would assume that it works, but I haven’t tried it. I’m not a big fan of a legend, I think it is much better if you place the labels directly into the figure. For an example see the next two figures:
http://www.gnuplotting.org/figs/histogram1.png
http://www.gnuplotting.org/figs/photo_luminescense1.png
For alignment, use optional “l” or “r” argument, as in
\shortstack[r]{bla\\blub}
Thanks a lot for this!