Gnuplotting

Create scientific plots using gnuplot

June 7th, 2011 | 6 Comments

A Klein bottle is a non-orientable surface, which has no defined left and right, as stated on Wikipedia. There we can also find a Gnuplot plot of the bottle, which we want to fine-tune a little bit in order to reach the result in Fig. 1.

Klein bottle

Fig. 1 Klein bottle (code to produce this figure)

In order to reach Fig. 1 we start with the definition of the parametric functions given in Wikipedia and do a simple pm3d plot with them.

set parametric
x(u,v)= v<2*pi ? (2.5-1.5*cos(v))*cos(u) : \
        v<3*pi ? -2+(2+cos(u))*cos(v)    : \
                 -2+2*cos(v)-cos(u)
y(u,v)= v<2*pi ? (2.5-1.5*cos(v))*sin(u) : \
                sin(u)
z(u,v)= v<pi   ? -2.5*sin(v)             : \
        v<2*pi ? 3*v-3*pi                : \
        v<3*pi ? (2+cos(u))*sin(v)+3*pi  : \
                 -3*v+12*pi
splot x(u,v),y(u,v),-z(u,v) w pm3d

The result is shown in Fig. 2.

Klein bottle

Fig. 2 Klein bottle plotted only with pm3d (code to produce this figure)

Now we add some lines to the surface and hide parts, which are not visible in 3d.

set pm3d depthorder hidden3d 1
set hidden3d

Here the depthorder option takes care of the right positioning of the bottleneck going back into the bottle, which is not correct in Fig. 2. The hidden3d 1 option draws lines in the right order for a correctly looking 3d plot using line style 1. The additional set hidden3d command takes care of showing only those lines that are visible in 3d. These options will result in Fig. 3.

Klein bottle

Fig. 3 Klein bottle plotted only with pm3d and hidden3d (code to produce this figure)

In order to reach at Fig. 1 we just have to set the surface to be transparent, which can be done by the set style fill command.

set style fill transparent solid 0.65

May 20th, 2011 | 4 Comments

The tikz and epslatex terminal directly write text in the graph by using LaTeX. But if you want a line break within a label, a simple \\ will not work. In order to get a line break we can apply the \shortstack command.

set label '\shortstack{first line\\second line}'

In the following example, a principal component analysis (PCA) for attribute ratings of a listening test has been computed and the attributes together with the presented stimuli are plotted in the graph. The natural + little comb filter attribute and its counterpart included a line break (click on the figure for a larger version).

loudspeaker circle

Fig. 1 A PCA plot with a line break in two of its attribute labels (click on the figure for a larger view, code to produce this figure)

May 6th, 2011 | 2 Comments

loudspeaker circle

Fig. 1 A circular loudspeaker array drawn with the object command (code to produce this figure, set_loudspeaker function)

In one of the last entries we have seen how to plot a loudspeaker with Gnuplot.
This time we will have a look at the case of setting more than one loudspeaker to your plot. Furthermore we allow the placement of the loudspeakers after entries in a data file.
Let us assume we have a data file containing the x position, y position and orientation phi of a single loudspeakers per line. Now we have to read the data with Gnuplot and set the objects according to the data. This can be done by a dummy plot, because by applying the plot command, variables can be stored. For the dummy plot we setting the output of the plot command to table and use /dev/null as the place to write the data.

# --- Read loudspeaker placement from data file
set table '/dev/null'
add_loudspeaker(x,y,phi) = sprintf(\
    'call "set_loudspeaker.gnu" "%f" "%f" "%f" "%f";',x,y,phi,0.2)
CMD = ''
plot 'loudspeaker_pos.dat' u 1:(CMD = CMD.add_loudspeaker($1,$2,$3))
eval(CMD)
unset table

The plot command now enables us to add the data from the file to the variable CMD, which is then executed by the eval command. To create the variable, the add_loudspeaker function creates a string with the data for every single line of the data file. The eval(CMD) calls the set_loudspeaker.gnu function once for every single data line, which corresponds to a single loudspeaker. The set_loudspeaker.gnu function itself does the same as we have done in the draw a single loudspeaker entry, but in addition it uses a rotation matrix to change the orientation of the single loudspeakers.

After having set the loudspeakers, we add some activity to three of the loudspeakers and finally get the result in Fig. 1.

# --- Plot loudspeaker activity
set parametric
fx(t,r,phi) = -1.5*cos(phi)+r*cos(t)
fy(t,r,phi) = -1.5*sin(phi)+r*sin(t)
set multiplot
set trange [-pi/6+pi/8:pi/6+pi/8]
plot for [n=1:3] fx(t,n*0.25,pi/8),fy(t,n*0.25,pi/8) w l ls 2
unset object
set trange [-pi/6-pi/8:pi/6-pi/8]
plot for [n=1:3] fx(t,n*0.25,-pi/8),fy(t,n*0.25,-pi/8) w l ls 2
set trange [-pi/6:pi/6]
plot for [n=1:3] fx(t,n*0.25,0),fy(t,n*0.25,0) w l ls 1
unset multiplot

The three waves before the desired loudspeakers are plotted within an iteration that effects the radius by using the for command. The unset object is executed after the first plot in the multiplot environment, because the loudspeakers should only be drawn once.

April 19th, 2011 | 3 Comments

Often we use a specific line color or output terminal in Gnuplot. Or we are not satisfied with one of the default settings, for example the font used by the png terminal. There exists an easy way to fix these settings. Gnuplot reads a startup file, called .gnuplot under Linux and GNUPLOT.INI under Windows. First it searches the current directory and then your home directory after that file.

Here is an example of what is possible to include in the startup file.

# enable macros
set macros
# search for functions or data files in these directories
set loadpath '/usr/local/lib/gnuplot'
# add default line colors
set style line 1 lc rgb '#0060ad' lt 1 lw 2 pt 5   # blue
set style line 2 lc rgb '#dd181f' lt 1 lw 2 pt 7   # red
# add macros to select the desired line style
BLUE = "1"
RED = "2"
# add macros to select a desired terminal
WXT = "set terminal wxt size 350,262 enhanced font 'Verdana,10' \
   persist"
PNG = "set terminal pngcairo size 350,262 enhanced font 'Verdana,10'"
SVG = "set terminal svg size 350,262 fname \
   'Verdana, Helvetica, Arial, sans-serif' fsize = 10"

With these settings and the use of macros our plotting will become more easier. For example to plot the sinusoid from the plotting functions introduction we can now use the following code.

@WXT
[...]
plot f(x) title 'sin(x)' with lines ls @BLUE, \
     g(x) notitle with lines ls @RED

Note that you have to omit the usage of reset in your code, because it will clear the line style settings.

Sinusoid

Fig. 1 Plotting using the configuration file (code to produce this figure)

You can of course override the style settings of the configuration file.

plot f(x) title 'sin(x)' with lines ls @BLUE, \
     g(x) notitle with lines ls @RED lw 1
Sinusoid

Fig. 1 Overwriting settings from the configuration file (code to produce this figure)

March 31st, 2011 | 3 Comments

Beside the epslatex terminal, Gnuplot offers another terminal which can be used in companion with LaTeX. The tikz terminal creates only a tex file without any eps file. The trick is that it uses the tikz environment of LaTeX to draw the whole plot with TeX.

The downside is that this terminal is a new one and not available in the most standard installations of Gnuplot and it could be that there are a few bugs in comparison to epslatex.

In order to install the tikz terminal we have to compile Gnuplot by ourself with the lua flag enabled and install it the usual way:

$ ./configure --with-lua=yes
$ make
# make install

To do so we have to install lua before of course. Under Debian and Ubuntu we have to fix also two links in order to find the lua package:

# ln -s /usr/lib/pkgconfig/lua5.1.pc  /usr/lib/pkgconfig/lua.pc
# ln -s /usr/lib/liblua5.1.so  /usr/lib/liblua.so

If the installation is complete, we can use the tikz terminal in the normal way

set teminal tikz

For lots of plots in our LaTeX document we can get a problem with the TeX memory. In order to fix this use more memory for TeX by changing the memory settings in /etc/texmf/texmf.cnf. In Debian and Ubuntu this can’t be done directly, but by editing /etc/texmf/texmf.d/95NonPath.cnf and running

# update-texmf

afterwards.
The memory can be increased by changing the following lines to these new values (which are the maximum values possible).

main_memory = 7999999
extra_mem_top = 7999999
extra_mem_bot = 7999999

March 15th, 2011 | No Comments

As you all know Gnuplot is able to add arrows or labels to your plot. But it can even add more complicated objects, by using the object command. You can choose if you want to add a rectangle, ellipse, circle, or polygon. Here we want to add a loudspeaker to our plot, hence we choose the polygon.

loudspeaker

Fig. 1 A loudspeaker drawn with the object command (code to produce this figure)

For a polygon you have to specify the points the polygon should combine. The following points will result in a shape of the desired loudspeaker.

a = 1.0/3
set object 1 polygon from \
    -1, 1 to \
     0, 1 to \
     0, a to \
     1, 1 to \
     1,-1 to \
     0,-a to \
     0,-1 to \
    -1,-1 to \
    -1, 1

After this we do some fine tuning on the appearance of the object and remove all borders and tics from the plot.

unset border
unset tics
set object 1 fc rgb '#000000' fillstyle solid lw 0

In order to draw the loudspeaker we need a plot command. For this we use the parametric mode to draw parts of circles with different radii. Here I will only present the used functions, for an explanation of the parametric mode have a look at the Understand parametric mode entry.

set trange [-pi/6:pi/6]
fx(t,r) = r*cos(t)
fy(t,r) = r*sin(t)

February 28th, 2011 | No Comments

There is a little update to the epslatex terminal introduction page.

The tics labels can automatically use the math mode from LaTeX by setting the right format option:

set format '$%g$'

Another change is to omit the \resizebox command in LaTeX to include the figure. The problem is that this command also scales your fonts, which you probably don’t want. The alternative is to specify the correct size of your plot before hand and then including the file only with:

\begin{figure}
    \input{file}
\end{figure}

November 30th, 2010 | No Comments

For some plots it is nice to have exactly the same size for the given unit on both axes. In Fig.1 you could see the amplitude of a point source in a given space.

Wave field

Fig. 1 Image plot of a wave field given by the data file data (code to produce this figure)

The wave field of the point source is given by Green’s function:

G(\mathbf{x}-\mathbf{x}_\text{s},\omega) = \frac{1}{4\pi |\mathbf{x}-\mathbf{x}_\text{s}|} \; e^{i \frac{\omega}{c} |\mathbf{x}-\mathbf{x}_\text{s}|}

To apply the same sizes at both axes the set ratio command is the one to look after. A value of -1 will ensure that we will get the same sizes.

set ratio -1

October 27th, 2010 | 11 Comments

If we have more than one graph that should be displayed in a figure, the multiplot command is the one to use in Gnuplot. But as we will see this is not a trivial task.
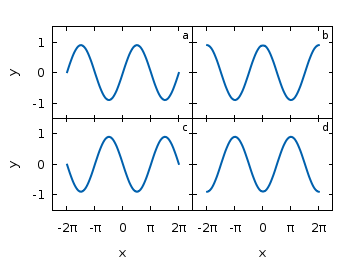
Let us consider we have four different functions that should be presented in the same figure as shown in Fig. 1.

nice multiplot

Fig. 1 A multiplot with reduced axes labeling and nicely arranged graphs (code to produce this figure)

The functions are given by:

# Functions (1/0 means not defined)
a = 0.9
f(x) = abs(x)<2*pi ? a*sin(x)           : 1/0
g(x) = abs(x)<2*pi ? a*sin(x+pi/2)      : 1/0
h(x) = abs(x)<2*pi ? a*sin(x+pi)        : 1/0
k(x) = abs(x)<2*pi ? a*sin(x+3.0/2*pi)  : 1/0

For an explanation of the used syntax to declare the functions have a look at the Defining piecewise functions article.

In a first attempt we just use the multiplot command:

### Start multiplot (2x2 layout)
set multiplot layout 2,2 rowsfirst
# --- GRAPH a
set label 1 'a' at graph 0.92,0.9 font ',8'
plot f(x) with lines ls 1
# --- GRAPH b
set label 1 'b' at graph 0.92,0.9 font ',8'
plot g(x) with lines ls 1
# --- GRAPH c
set label 1 'c' at graph 0.92,0.9 font ',8'
plot h(x) with lines ls 1
# --- GRAPH d
set label 1 'd' at graph 0.92,0.9 font ',8'
plot k(x) with lines ls 1
unset multiplot
### End multiplot

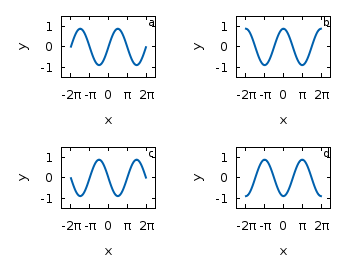
We also added a label to every graph in order to identify them easily in the figure. Note that we overwrite the label 1 for every graph. If we don’t do that, then on the last graph all four labels will be present. Using this simple approach we will get Fig. 2. As you can see this is not an ideal case to use the space in the figure. The xtics and the ytics are just the same in every graph and are not needed to be displayed on every graph.

simple multiplot

Fig. 2 A straightforward use of the multiplot command to plot four different functions (code to produce this figure)

But before we fix this we will introduce the use of macros in order to shorten the code a lot. As you can see in the code block above, the set label command contains the same position for every graph. We can shorten this by:

set macros
# Placement of the a,b,c,d labels in the graphs
POS = "at graph 0.92,0.9 font ',8'"
[...]
set label 1 'a' @POS
plot f(x) with lines ls 1

and so on for the other graphs.

But the macros are not only useful for the different labels, but also for the other settings of the multiplot.
First we want to remove the x/y-tics and labels, where they are not necessary. Here it is the same as with the label settings. Every graph uses the settings from the graph before, if we didn’t change these settings. In order to remove the xtics at a given graph we have to tell this explicitly. Therefore we define macros for the two cases label+tics vs. nolabel+notics:

# x- and ytics for each row resp. column
NOXTICS = "set xtics ('' -2*pi,'' -pi,'' 0,'' pi,'' 2*pi); \
          unset xlabel"
XTICS = "set xtics ('-2π' -2*pi,'-π' -pi,'0' 0,'π' pi,'2π' 2*pi);\
          set xlabel 'x'"
NOYTICS = "set format y ''; unset ylabel"
YTICS = "set format y '%.0f'; set ylabel 'y'"

These will then be used in the plotting section:

# --- GRAPH a
@NOXTICS; @YTICS
[...]
# --- GRAPH b
@NOXTICS; @NOYTICS
[...]
# --- GRAPH c
@XTICS; @YTICS
[...]
# --- GRAPH d
@XTICS; @NOYTICS

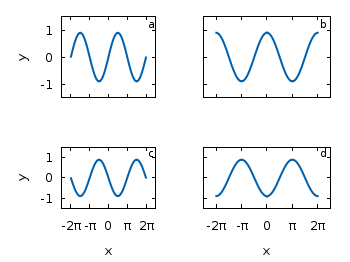
Applying the axes settings will result in Fig. 3.

multiplot

Fig. 3 A multiplot with reduced axes labeling (code to produce this figure)

Now the label etc. on the axes are done in a nice way, but the sizes and the spaces between the individual graphs are very bad. This comes from the fact that Gnuplot calculates the size of a graph depending on the presence of tics and labels. In order to have graphs with the same size and align them without spaces between them we have to set the margins of the individual graphs manually.

# Margins for each row resp. column
TMARGIN = "set tmargin at screen 0.90; set bmargin at screen 0.55"
BMARGIN = "set tmargin at screen 0.55; set bmargin at screen 0.20"
LMARGIN = "set lmargin at screen 0.15; set rmargin at screen 0.55"
RMARGIN = "set lmargin at screen 0.55; set rmargin at screen 0.95"

The trick is that we use the at screen command to arrange the margins absolutely in the figure. As you can see the bottom margin of the two figures in the top is placed at 0.55, the same value the top margin of the two lower graphs start.
These margins are then added in the same way to the multiplot command as the label settings and we get:

# --- GRAPH a
@TMARGIN; @LMARGIN
[...]
# --- GRAPH b
@TMARGIN; @RMARGIN
[...]
# --- GRAPH c
@BMARGIN; @LMARGIN
[...]
# --- GRAPH d
@BMARGIN; @RMARGIN

Having done all this we will finally get our desired figure which is shown in Fig. 1.

October 13th, 2010 | 1 Comment

If you have to place a lot of labels in your plot and don’t know their place exactly, it can take a very long time to find the right positions. You will specify a position in the set label command and execute it, adjust the position and execute it again, etc.

But their is an easier way. You can use a Gnuplot script to place your labes interactive by hand and get the corresponding label position coordinates. To give you a clue how it functions, have a look at this video:

Fig. 1 Video to show interactive label placing (code to produce this figure, label_loop function)

The Gnuplot code to generate this video is stored in two files. One normal Gnuplot file for plotting the points, using a technique presented in the Plotting single points entry. At the end of the file, after the plot command another Gnuplot file is called with the label to place. Also the set mouse command enables the use of the mouse for our interactive purposes.

# Enable interactive use of the mouse
set mouse

# Adding the labels (INTERACTIVE)
print "\nPosition the labels with your left mouse until you are \ convinced with their position by pressing another key.\n"

call 'label_loop.gnu' 'square'
call 'label_loop.gnu' 'circle'
call 'label_loop.gnu' 'triangle'

print "Done"

Here the call command calls the function label_loop.gnu with the given label as a parameter. In the label_loop.gnu file the label placing is handled. A label is added or placed at a new position as long as the left mouse key is clicked. If the right mouse key (or any other key) is pressed the label is positioned at the last chosen position. This position is also printed to the standard output every time a new position is chosen.

# Initialize a label number
if (!exists("label_number")) label_number = 1;

# Waiting for the key press and display the given label
pause mouse any "$0"

# Check if the left mouse key is pressed and add the given label to the
# plot. Otherwise stop the loop and count the added label
if( MOUSE_BUTTON==1 ) \
    set label label_number "$0" at MOUSE_X,MOUSE_Y textcolor ls 1;\
    print "\n $0 at ",MOUSE_X,MOUSE_Y;\
    replot;\
    reread;\
else \
    label_number = label_number+1;\
    print "\n"

The variable label_number is needed in order to work with more than one label.

If you want to position the center of the label at the mouse position, you can change the set label line to

set label label_number "$0" at MOUSE_X,MOUSE_Y center textcolor ls 1;\