August 22nd, 2013 | 30 Comments
On the PGF plots page I found a nice example of visualizing data with cubes. Here we will recreate the same with gnuplot as you can see in Fig. 1.
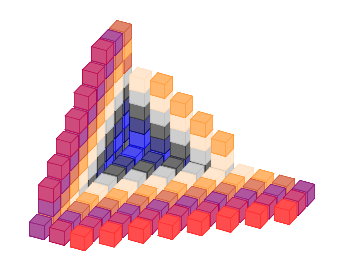
Fig. 1 Cubes with different colors. (code to produce this figure, cube function, data)
We need basically two things in order to achieve it. First we have to plot a single cube with gnuplot. This is not as straight forward as you may think. We have to define a data file for it and plot it with the pm3d style which will result in Fig. 2.
# single cube
0 0 0
0 0 1
0 1 1
0 1 0
0 0 0

1 0 0
1 0 1
1 1 1
1 1 0
1 0 0

0 0 0
1 0 0
1 1 0
0 1 0
0 0 0

0 0 1
1 0 1
1 1 1
0 1 1
0 0 1
set cbrange [0.9:1]
set palette defined (1 '#ce4c7d')
set style line 1 lc rgb '#b90046' lt 1 lw 0.5
set pm3d depthorder hidden3d
set pm3d implicit
unset hidden3d
splot 'cube.txt' u 1:2:3:(1) w l ls 1
The use of the fourth (1) column for the splot command ensures that the cube gets the same color on every side. Only the edges are highlighted by a slighty different color given by the line style.

Fig. 2 A single cube. (code to produce this figure, data)
In a second step we reuse the code from the Object placement using a data file entry in order to plot cubes at different positions with different colors. To get the different colors and positions we replace the cube.txt file with a cube function that returns the values for the desired position and color.
add_cube(x,y,z,c) = sprintf('cube(%f,%f,%f,%i) w l ls %i,',x,y,z,c,c)
CMD = ''
stats 'cube_positions.txt' u 1:(CMD = CMD.add_cube($1,$2,$3,$4)) nooutput
CMD = 'splot '.CMD.'1/0 w l ls 2'
eval(CMD)
[…] Plotting cubes (gnuplotting.org) […]
Hello;
“Code to produce this figure” Link at the Fig 1. is not Working.
However, cube part is amazing. Thank you for your work. Really impessive.
Emre
Thanks, I corrected the link.
If I wanted prisms instead cubes, is possible to do it ? for example i have the coordinates of six prisms (the bottom,left and front node) with six different heights.
for i=1,5 the height prism changes with the index h=1.0*i, the z cooordinate of the sixth prism is above from the others and its height is greater than others. So the function cube changes with each prism, how can i do a loop at the code? Thanks for your answer
Many thanks! Great work.
When I active the tic option on, the coordinate system seems to me a diaster.
Do you have any correction for this version that the coordiante system could be just in the middle and every tic works fine without the color flag flot?
Moreover, I wish I could define every length of cube I want to draw, if that’s not too much difficult to write it on.
Thank you.
Hi Laurent.
If you comment the two lines with the border and tics settings
you will get a normal coordinate system with tics. If the coordinate system should be centered at z=0 you can achieve this by
If you further want to change the length of every cube you have to add another option to the cube function that can do this.
Hi Hagen,
I tried to run both codes “single_cube.gnu” and “cube.gnu” under Gnuplot 4.6 Patch level 3.
Unfortunately I got always a message like this one:
line 67: warning: Skipping unreadable file “<echo "0.000000 0.000000 0.000000 3\n0.000000 0.000000 1.000000 3\n0.000000 1.000000 1.000000 3\n0.000000 1.000000 0.000000 3\n0.000000 0.000000 0.00
0000 3\n\n1.000000 0.000000 0.000000 3\n1.000000 0.000000 1.000000 3\n1.000000 1.000000 1.000000 3\n1.000000 1.000000 0.000000 3\n1.000000 0.000000 0.000000 3\n\n0.000000 0.000000 0.000000 3\n1.000000 0
.000000 0.000000 3\n1.000000 1.000000 0.000000 3\n0.000000 1.000000 0.000000 3\n0.000000 0.000000 0.000000 3\n\n0.000000 0.000000 1.000000 3\n1.000000 0.000000 1.000000 3\n1.000000 1.000000 1.000000 3\n
0.000000 1.000000 1.000000 3\n0.000000 0.000000 1.000000 3""
Any idea? It seems that the function cube.fct is not really understood from Gnuplot.
By the way, your idea is great! But of course I would like to understand why I have this error message.
Thanks in advance.
Carl.
Hi Carl.
That is strange, I have gnuplot 4.6 patchlevel 0 and get no error at all. Even the line showing in your error message seems to be ok to me. Are you running under Linux?
Hello Hagen,
no I am running gnuplot under Windows XP Professional!
As you say, it is quite strange.
Could it be that something under Windows must be done?
Thank you in advance.
Carl.
I never really tested gnuplot under Windows, but it could be that the
echocommand is not available at all under Windows or not working as expected. You could test it for example by plotting single points as explained here.Impressive looking chart but I’m something of a gnuplot novice and I cannot seem to get this example to work with either gnuplot 4.4.3 or 4.6.5 under ubuntu 12.04 LTS.
I first get a diagnostic about a missing argument in the ‘set pm3d’ line, which was easy to get past by adding a digit.
The second error involves a complaint about the stats line:
stats ‘cube_positions.txt’ u 1:(CMD = CMD.add_cube($1,$2,$3,$4))
^
“./cube.gnu”, line 64: invalid command
at which point my (few) attempts to come up with a workaround have proven insufficient.
Hi Tim.
Did you really used gnuplot 4.6.5? Because the
statscommand should be part of it. Did you make sure that the cube.gnu and cube.fct file were in the same directory you ran the code?For me the cube.gnu file is still working.
I can plot the single cube, however when I try to plot the multiple cubes I get a .png file with nothing in it. No errors, just seems like its not plotting anything… I’m not sure if the function is working for me
Hi adam.
That’s correct in newer versions of gnuplot the script for the multiple cubes is no longer working.
The
statscommand complains that no data are in its range. I moved the range definitions after stats and now it is working again.I updated the code in the blog entry as well.
German-English typo: “This is not as straight forward as you may thing.” -> think.
Thanks, I corrected it.
Hello Hagen,
even when I try to plot that figure with your code, i get an error message:
…cube(12.600000,9.600000,0.000000,2) w l ls 2,cube(12.600000,10.800000,0.000000,3) w l ls 3,1/0 w l ls 2
^
cannot create pipe for data
Do you know, what im doing wrong?
Where is my mistake?
Im using Gnuplot 5.0 – is that the Problem?
Thanks for your help.
Hi Jojo.
Which version of gnuplot do you exactly use and on what operating system?
If I rerun the code under Linux with gnuplot 5.0 it is still working for me, although the result looks slightly different due to a change in how the linetype is handled in 5.0.
Hi Hagen,
thanks for your feedback.
I´m using Version 5.0 patchlevel 0 on Windows 7 Professional.
I read that the plots were done unnder Linux.
But is there no possibility to get the results on Windows?
Hi, thank you so much for this tutorial. I’m currently extending your gnuplot scripts to draw rectangular blocks as well, and have ran into the following dilemma:
When I draw rectangles, one of the sides of block A maybe:
2 0 0
2 0 1
0 0 1
0 0 0
2 0 0
– basically a rectangular surface parallel to the xz plane with height of 1 unit and length of 2 unit.
and one of the sides of block B maybe:
1 0 0
1 0 1
1 1 1
1 1 0
1 0 0
– a square parallel to the zy plane intersecting the first surface at segment (1 0 0) (1 0 1).
Then, if you look from the positive xyz direction towards the origin, even though the second surface should cover the first surface, because a point in the first surface is closer to the viewer, the first surface covers the second surface.
Illustration: http://imgur.com/a/CcGO1
Thank you for your work!
How should I modify the code to draw only three edges of the cube (only those which can be observed)? I want to decrease the time to plot the graph and to decrease the size of resulting *.eps.
I wondered that each of 6 edges coordinates are listed in the “cube” function, so I can delete 3 of them. But I’ve found there are only 4 edges.
Thanks!
If this code doesn’t work properly, replace “echo” by “printf”.
When I run the cube.gnu plot on GP 5.2 I get a “line 67: out of memory for pm3d_plot->quadrangles” error. This is true for the png and the wxt terminals. Thoughts?
I downloaded and tried the example code…. for the multi cube example it draws a blank white display with nothing in it.
the only difference is
set terminal X11 and I am using gnuplot 5.2
The reddish single cube example works.
For the multi-cube example
gnuplot> print CMD
splot cube(0.000000,0.000000,0.000000,3) w l ls 3,cube(0.000000,1.200000,0.000000,4) w l ls 4,cube(0.000000,2.400000,0.000000,5) w l ls 5,cube(0.000000,3.600000,0.000000,6) w l ls 6,cube(0.000000,4.800000,0.000000,7) w l ls 7
[… truncated etc….]
trying to splot the first cube
gnuplot> splot cube(0.000000,0.000000,0.000000,3) w l ls 3
Warning: Single isoline (scan) is not enough for a pm3d plot.
Hint: Missing blank lines in the data file? See ‘help pm3d’ and FAQ.
result white gnuplot xterm with nothing in it…..
Unfortunately I cant figure out how to fix it.
Any ideas would be appreciated.
Thanks
Can you try with the PNG terminal?
For me it still works with gnuplot 5.2 and produces this output. It has slightly different line colors as the original as the definition of linetypes changed in gnuplot 5.0:
Fig. 3 Cubes with different colors plotted with Gnuplot>=5.0. (code to produce this figure, cube function, data)
I think it might be my installation. I will have to install all the missing packages locally.
Is there a standard location for the install logs to identify what failed to build.
png is missing.
set terminal
Available terminal types:
canvas HTML Canvas object
cgm Computer Graphics Metafile
context ConTeXt with MetaFun (for PDF documents)
domterm DomTerm terminal emulator with embedded SVG
dumb ascii art for anything that prints text
dxf dxf-file for AutoCad (default size 120×80)
eepic EEPIC — extended LaTeX picture environment
emf Enhanced Metafile format
emtex LaTeX picture environment with emTeX specials
epslatex LaTeX picture environment using graphicx package
fig FIG graphics language for XFIG graphics editor
hpgl HP7475 and relatives [number of pens] [eject]
latex LaTeX picture environment
mf Metafont plotting standard
mp MetaPost plotting standard
pcl5 HP Designjet 750C, HP Laserjet III/IV, etc. (many options)
postscript PostScript graphics, including EPSF embedded files (*.eps)
pslatex LaTeX picture environment with PostScript \specials
pstex plain TeX with PostScript \specials
pstricks LaTeX picture environment with PSTricks macros
qms QMS/QUIC Laser printer (also Talaris 1200 and others)
svg W3C Scalable Vector Graphics
tek40xx Tektronix 4010 and others; most TEK emulators
tek410x Tektronix 4106, 4107, 4109 and 420X terminals
texdraw LaTeX texdraw environment
tgif TGIF X11 [mode] [x,y] [dashed] [“font” [fontsize]]
tkcanvas Tk canvas widget
tpic TPIC — LaTeX picture environment with tpic \specials
unknown Unknown terminal type – not a plotting device
vttek VT-like tek40xx terminal emulator
x11 X11 Window System interactive terminal
xlib X11 Window System (dump of gnuplot_x11 command stream)
xterm Xterm Tektronix 4014 Mode
Thank you,
Mike
Single cube:
This works : Draws single reddish cube
splot ‘cube.txt’ u 1:2:3:(1) w l ls 1
But using code example this does not: Draws white blank gnuplot
splot cube(0,0,0,1) w l ls 1
Warning: Single isoline (scan) is not enough for a pm3d plot.
Hint: Missing blank lines in the data file? See ‘help pm3d’ and FAQ.
The code is not working in Version 5.4.1. I get nothing in the screen.
Thank you very much.
Sidiney
I replace “echo” by “printf” in cube.fct and work.
Thank you very much.
Sidiney
Hey
does any know how to make only some of the cubes to: set style fill transparent solid 0.3 noborder?
thanx in advance
Rasmus