Gnuplotting

Create scientific plots using gnuplot

September 23rd, 2016 | 4 Comments

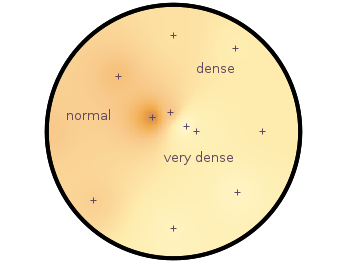
Suppose you have a large circular container filled with sand and measure its density at different positions. Now the goal is to display your measurements as a heat map extrapolated from your measurements, but limiting that heat map to the inner part of the container as shown in Fig. 1.
circular heat map

Fig. 1 Sand density measured at different positions in a circular container (code to produce this figure, sand.pal, data)

The underlying measurements are provided in the following format:

# sand_density_orig.txt
#1      2        3        4      5       6
#prob   x        y        z      density description
"E01"   0.00000 -1.14161 -0.020  0.7500  "dense"
"E02"  -0.94493 -0.81804 -0.020  0.5753  "normal"
"E03"   0.75306 -0.72000 -0.020  0.7792  "dense"
...

Those data points have to be extrapolated onto a grid for the heat map, which can be achieved by the following commands.

set view map
set pm3d at b map
set dgrid3d 200,200,2
splot "sand_density1.txt" u 2:3:5

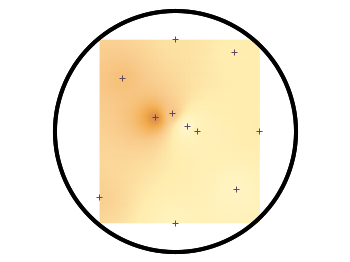
Fig. 2 shows the result which has two problems. The grid data is limited to the boundary given by the measurement points. In addition, the grid is always rectangular in size and not circular.
circular heat map

Fig. 2 Sand density measured at different positions in a circular container (code to produce this figure, sand.pal, data)

To overcome the first problem you have to add four additional points to the original data in order to stretch the grid boundary to the radius of the container. For that you have to come up with some reasonable extrapolation from the existing points. I did this in a very simple way by a mixture of linear interpolation or using the value of the nearest point. If you want to do the same with your data set you should maybe spent a little bit more effort on this.

# sand_density.txt
#1      2        3        4      5       6
#prob   x        y        z      density description
"E01"   0.00000 -1.14161 -0.020  0.7500  "dense"
...
"xmin" -1.50000  0.00000 -0.050  0.5508  "dummy"
"xmax"  1.50000  0.00000 -0.050  0.6634  "dummy"
"ymin"  0.00000 -1.50000 -0.050  0.7500  "dummy"
"ymax"  0.00000  1.50000 -0.050  0.6315  "dummy"

If you plot those modified data set you will get Fig. 3.
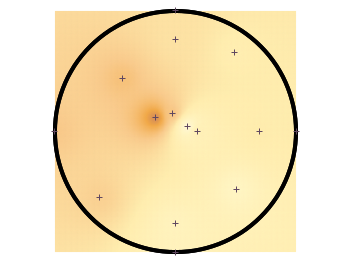
circular heat map

Fig. 3 Sand density measured at different positions in a circular container (code to produce this figure, sand.pal, data)

In order to limit the heat map to a circle you first extrapolate the grid using dgrid3d and store the data in a new file.

set table "tmp.txt"
set dgrid3d 200,200,2
splot "sand_density2.txt" u 2:3:5
unset table

Afterwards a function is defined in order to limit the points to the inner of the circle and plot the data from the temporary file.

circle(x,y,z) = sqrt(x**2+y**2)>r ? NaN : z
plot "tmp.txt" u 1:2:(circle($1,$2,$3)) w image

Finally a few labels and the original measurement points are added. The manually added points like xmin are removed by a smaller radius value. The result is then the nice circular heat map in Fig. 1.

r = 1.49 # make radius smaller to exclude interpolated edge points
set label 'normal' at -1,0.2 center front tc ls 1
set label 'dense' at 0.5,0.75 center front tc ls 1
set label 'very dense' at 0.3,-0.3 center front tc ls 1
plot "sand_density.txt" \
         u (circle($2,$3,$2)):(circle($2,$3,$3)) w p ls 1
March 2nd, 2015 | 4 Comments

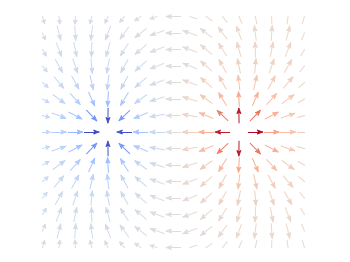
If you are a regular gnuplot user you most probably want to reuse some common settings. I normally avoid it on this blog to have easy scripts that run as standalone files, but during my work I use a lot of small config files.

Bessel functions

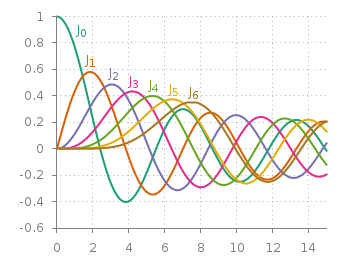
Fig. 1 Bessel functions from order zero up to six plotted with the dark2 line colors. (code to produce this figure, dark2.pal, xyborder.cfg, grid.cfg, mathematics.cfg)

Let us start with the Bessel function example from the last blog entry. As you can see in Fig. 1, it is a 2D plot, including axes, a grid, line colors, and definitions of higher order Bessel functions. All of those could be easily stored in small config files and reused in other plots.
As an example I will start with the axes. Here, I have four different config files, called xyborder.cfg, xborder, yborder.cfg, noborder.cfg, which do exactly what their names would suggest. Here are the first and last file:

# xyborder.cfg
set style line 101 lc rgb '#808080' lt 1 lw 1
set border 3 front ls 101
set tics nomirror out scale 0.75
set format '%g'
# noborder.cfg
set border 0
set style line 101 lc rgb '#808080' lt 1 lw 1
unset xlabel
unset ylabel
set format x ''
set format y ''
set tics scale 0

In the main plotting file I then just have to load the setting I like to have and I’m done. The same can be done for adding a grid, the right line color definitions and the extra Bessel functions leading to the following excerpt from the main plotting file:

# set path of config snippets
set loadpath './config'
# load config snippets
load 'dark2.pal'
load 'xyborder.cfg'
load 'grid.cfg'
load 'mathematics.cfg'

The set loadpath command tells gnuplot the directory where it can find all the configuration snippets. If you want to see an overview, look at my gnuplot configuration snippets and at the collection of palettes and line colors.

If you want to include more complicated settings, you have to use the macro setting of gnuplot. Fig. 2 is a reproduction of an earlier entry plotting a vector field with arrows. It included an lenghty definition of how to plot these arrows. If you want to do it several time and define the arrows in the same way every time you should also put it into a config file, this time as a variable (macro). In our example it looks like

color_arrows = 'u ($1-dx($1,$2)/2.0):($2-dy($1,$2)/2.0):(dx($1,$2)):(dy($1,$2)):\
(v($1,$2)) with vectors head size 0.08,20,60 filled lc palette'

In the main file the only thing we have then to do is

set macros
load 'noborder.cfg'
load 'moreland.pal'
load 'arrows.cfg'

# [...] 

plot '++' @color_arrows

Important is the first line that enables the use of macros in gnuplot which is disabled by default.

June 23rd, 2014 | 8 Comments

Occasionally it is a good idea to create a zoom of some part of your main plot, especially if you have a small part of your plot where the data is hiding each other.

Including a zoom with multiplot

Fig. 1 Including a zoom into your figure to emphasize some data. (code to produce this figure, data)

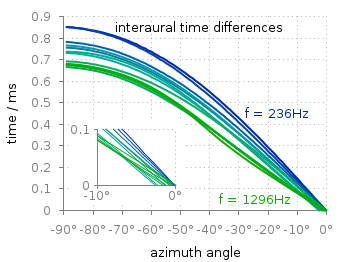
In Fig. 1 the interaural time difference between a sound signal reaching the two ears of a listener is plotted with different colors for different frequencies. The data is very dense around 0°, so we include a zoom into this region in the same figure at a free place.

This can be done via multiplot and the plotting of the same data in a smaller figure.

set origin 0.12,0.17
set size 0.45,0.4
set xrange [-10:0]
set yrange [0:0.1]
plot for [n=2:13] 'itd.txt' u 1:(column(n)*1000) w lines ls n

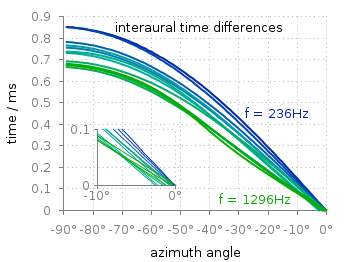
The tricky part is that we have a grid in our main figure and if we do nothing the grid will also be visible in the zoomed in version as shown in Fig. 2.

Including a zoom with multiplot without grid correction

Fig. 2 Including a zoom into your figure, without correcting the grid. (code to produce this figure, data)

To avoid this we have to hide the grid in the background of the zoomed graph. This is done with the trick of placing an empty white rectangle at the place the zoom plot should appear in the figure.

set object 1 rect from -88,0.03 to -49,0.41
set object 1 rect fc rgb 'white' fillstyle solid 0.0 noborder

This will then finally lead to the desired result presented in Fig. 1.

August 17th, 2012 | 7 Comments

As already mentioned gnuplot 4.6 overs an easier way to include loops in your code.
Here we are using it to create an animation of a set of head related impulse responses, which show differences in amplitude and arrival time at the left and right ear of a listener depending on the position of the source.

Fig. 1 Video animation of head related impulse responses (HRIRs) (code to produce this figure, data)

In comparison to the additional file for the loop in Animation I – gif, now all we need is this small code block.

do for [ii=1:181] {
    set output sprintf('hrir_frame%03.0f.png',ii)
    set multiplot layout 2,1
    [...]
    plot 'ir.txt' u ($1*1000):2*ii-1 w l ls 1
    [...]
    plot 'ir.txt' u ($1*1000):2*ii w l ls 1
    [...]
}

March 5th, 2012 | 3 Comments

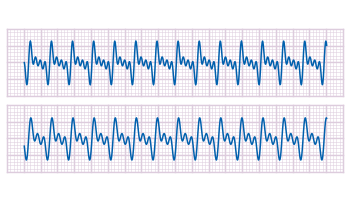
If you want to compare some time series of data with each other it could be a good idea to plot them just onto a grid without anything else. Here we will generate a scale paper like grid and plot two simple functions on it.

colored lines

Fig. 1 Plotting some time data on scale paper like grid (code to produce this figure)

In Fig. 1, two harmonic tone complexes are shown, plotted within the multiplot environment. But the thing to consider here is the grid below them. In order to get such a grid, we have to remove all borders and tics. This is done by the following code.

set style line 11 lc rgb '#ffffff' lt 1
set border 0 back ls 11
set tics out nomirror scale 0,0.001
set format ''

The second number of scale for the tics corresponds to the minor tics and must be greater than zero, otherwise no minor tics will appear.

In the last step we enable minor tics on both axes, set the style for the grid and define the grid itself.

set mxtics
set mytics
set style line 12 lc rgb '#ddccdd' lt 1 lw 1.5
set style line 13 lc rgb '#ddccdd' lt 1 lw 0.5
set grid xtics mxtics ytics mytics back ls 12, ls 13

August 11th, 2011 | 6 Comments

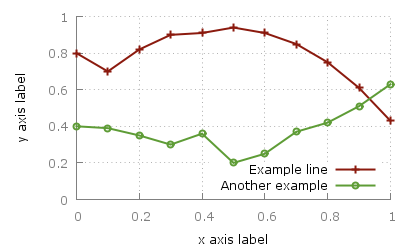
As you surely have noticed I don’t use the default colors and line styles from Gnuplot, but define them myself. The simple reason is that the default colors are not optimized to be very pleasant, but are simply primary colors. I just stumbled over an blog entry of Brighten Godfrey, which deals with some thoughts on beautiful plots.
He suggest to create scientific plots like the way he created his figure which I have reproduced more or less accurate in Fig. 1.

nice plot

Fig. 1 Nice plot with the pngcairo terminal (code to produce this figure, data)

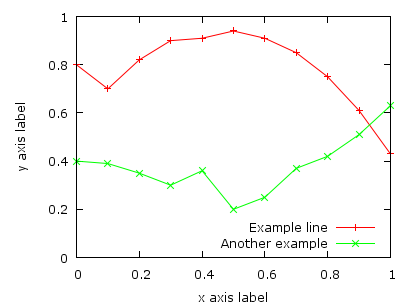
In Fig. 2 the default output of the pngcairo terminal is shown. I think the difference is quiet obvious.

not so nice plot

Fig. 2 Default output of the pngcairo terminal (code to produce this figure, data)

In the following I will have a look at the things we have to do to reach Fig. 1 and why we should do this:

1) change the default colors to more pleasant ones and make the lines a little bit thicker

set style line 1 lc rgb '#8b1a0e' pt 1 ps 1 lt 1 lw 2 # --- red
set style line 2 lc rgb '#5e9c36' pt 6 ps 1 lt 1 lw 2 # --- green

2) put the border more to the background by applying it only on the left and bottom part and put it and the tics in gray

set style line 11 lc rgb '#808080' lt 1
set border 3 back ls 11
set tics nomirror

3) add a slight grid to make it easier to follow the exact position of the curves

set style line 12 lc rgb '#808080' lt 0 lw 1
set grid back ls 12

The last thing I would like to mention is the problem, that the output of the svg terminal is slightly different from the pngcairo terminal. Especially the dashed line of the grid is not created in the right way, even though the dashed option is used for the terminal. This and a solution to convert the lines to dashed versions is also mentioned in the plotting the world entry.

nice plot with svg terminal

Fig. 1 Nice plot with the svg terminal (code to produce this figure, data)

July 11th, 2010 | 5 Comments

In the Gnuplot demo files folder that comes with your Gnuplot installation exists the file world.dat which contains data in order to plot a map of the world. Therefore we remove the key from the figure and set a grid (the dashed line in Fig. 1). Also we remove the tics by setting the format to nothing and the scale to zero. We could also remove the tics with unset tics, but the grid depends on the tics positions. After that we just plot the data:

unset key
set grid
set format ''
set tics scale 0
plot 'world.dat' with lines linestyle 1
The world

Fig. 1 A 2D plot of the world (code to produce this figure)

Here you can see a problem of the svg terminal of Gnuplot: it can’t produce dashed lines. In order to fix this, we can use Inkscape and open the svg file. Then pressing CRTL+F and type gray into the Style field and hit Enter. Now all the grid lines should be selected and you can set their stroke style to dashed by typing CRTL+Shift+F and choose one under Dashes. Doing so will lead to a figure shown in Fig. 2.

The world

Fig. 2 The 2D plot of the world edited with Inkscape

We can also easily draw a whole globe in 3D from the given data. Therefore we first add a gray line style, unset the border and arrange the figure margins.

set style line 2 lc rgb '#c0c0c0' lt 1 lw 2
unset border
set lmargin screen 0
set bmargin screen 0
set rmargin screen 1
set tmargin screen 1

The 3D plot needs a little more settings. We have to tell Gnuplot to map the data on a sphere and using angle values in degree. Also we want to have a non transparent world, therefore we need hidden3d. We arrange the appeareance of the plot by setting the xy-plane to the lowest z value in order to avoid an
offset between the lowest z vlaue an the xy-plane. To have Europe in the center we set also the viewport.

set mapping spherical
set angles degrees
set hidden3d
set xyplane at -1
set view 56,81

For the grid we have to remove the set grid command, because it doesn’t work with splot. So we draw the grid by our own using the parametric mode and finally plot the whole globe:

set parametric
set isosamples 25
set urange[0:360]
set vrange[-90:90]
splot cos(v)*cos(u),cos(v)*sin(u),sin(v) with lines linestyle 2, \
      'world.dat' with lines linestyle 1
The world

Fig. 3 A 3D plot of the world (code to produce this figure)

As you can see we have some problems with the data for Africa which lies behind the grid at some points. To avoid this and to make the grid dashed again we draw a grid with tinier radius and use Inkscape.

r = 0.99
splot r*cos(v)*cos(u),r*cos(v)*sin(u),r*sin(v) with lines \
      linestyle 2, \

In order to select the grid in Inkscape we have to search after the Style blue for some strange reason (on another PC green was the right color to search). You may have a look at the xml data to figure this out. Therefore under Edit you will find XML Editor. We not only set the stroke style to dashed we also lowered the selected objects
to avoid that any line of the grid covered a black world line. Having done all that we will finally get the nice globe in Fig. 4.

The world

Fig. 4 The 3D plot of the world edited with Inkscape