June 9th, 2010 | 11 Comments
If you have measurement data and like to plot them as points combined by lines, you will probably do that with the linespoints plotting style. But for some applications it is required to combine the data points by non-continuous lines to emphasize that the data came from measurements as shown in Fig. 1.
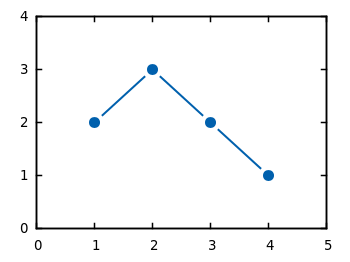
Fig. 1 Plot of the data from plotting_data1.dat with non-coninuous lines between its points (code to produce this figure)
In Gnuplot exists no line style that can do this directly. But with a little trick it is very easy to achieve. Since Gnuplot 4.4. there exists the property pointinterval (see the documentation) in combination with the plotting style linespoints. This property plots not every single point, but only every second for a value of 2 and so on. But if we use the value -1 it tells Gnuplot to insert a little gap between the points and the line. The size of the gap can be set by the pointintervalbox property.
set style line 1 lc rgb '#0060ad' lt 1 lw 2 pt 7 pi -1 ps 1.5
set pointintervalbox 3
We specify a point interval pi of -1 and a point size of 1.5, in addition we set the the gap to a point size of 3. Now we can plot our data with the linespoints style.
plot 'plotting_data1.dat' with linespoints ls 1
Using the same data as in the first plot of the gnuplot basics tutorial Plotting data we will get Fig. 1 as a result.