Gnuplotting

Create scientific plots using gnuplot

September 3rd, 2016 | 2 Comments

Matplotlib has four new colormaps called viridis, plasma, magma, and inferno. Especially viridis you might have seen already as this will be the new default in Matplotlib 2.0. They are freely available and now also included in the gnuplot-palettes repository on github. They are well designed to be perceptually uniform and friendly for common forms of colorblindness, so they should be save to use as your default colormap. Personally I would not recommend them for every kind of plot as they are a little dark if you have large areas with low values in your plot.

As usual in the gnuplot-palettes repository they are accompanied by line style definitions using the palette colors.

# viridis
set style line  1 lt 1 lc rgb '#440154' # dark purple
set style line  2 lt 1 lc rgb '#472c7a' # purple
set style line  3 lt 1 lc rgb '#3b518b' # blue
set style line  4 lt 1 lc rgb '#2c718e' # blue
set style line  5 lt 1 lc rgb '#21908d' # blue-green
set style line  6 lt 1 lc rgb '#27ad81' # green
set style line  7 lt 1 lc rgb '#5cc863' # green
set style line  8 lt 1 lc rgb '#aadc32' # lime green
set style line  9 lt 1 lc rgb '#fde725' # yellow
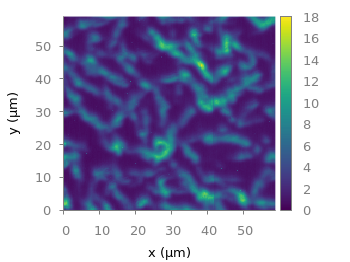
viridis colormap

Fig. 1 Photoluminescence yield plotted with the viridis colormap from Matplotlib (code to produce this figure, viridis.pal, data)

# plasma
set style line  1 lt 1 lc rgb '#0c0887' # blue
set style line  2 lt 1 lc rgb '#4b03a1' # purple-blue
set style line  3 lt 1 lc rgb '#7d03a8' # purple
set style line  4 lt 1 lc rgb '#a82296' # purple
set style line  5 lt 1 lc rgb '#cb4679' # magenta
set style line  6 lt 1 lc rgb '#e56b5d' # red
set style line  7 lt 1 lc rgb '#f89441' # orange
set style line  8 lt 1 lc rgb '#fdc328' # orange
set style line  9 lt 1 lc rgb '#f0f921' # yellow
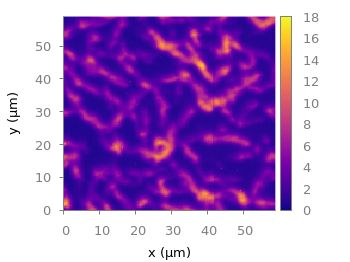
plasma colormap

Fig. 2 Photoluminescence yield plotted with the plasma colormap from Matplotlib (code to produce this figure, plasma.pal, data)

# magma
set style line  1 lt 1 lc rgb '#000004' # black
set style line  2 lt 1 lc rgb '#1c1044' # dark blue
set style line  3 lt 1 lc rgb '#4f127b' # dark purple
set style line  4 lt 1 lc rgb '#812581' # purple
set style line  5 lt 1 lc rgb '#b5367a' # magenta
set style line  6 lt 1 lc rgb '#e55964' # light red
set style line  7 lt 1 lc rgb '#fb8761' # orange
set style line  8 lt 1 lc rgb '#fec287' # light orange
set style line  9 lt 1 lc rgb '#fbfdbf' # light yellow
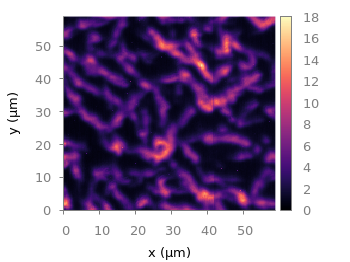
magma colormap

Fig. 3 Photoluminescence yield plotted with the magma colormap from Matplotlib (code to produce this figure, magma.pal, data)

# inferno
set style line  1 lt 1 lc rgb '#000004' # black
set style line  2 lt 1 lc rgb '#1f0c48' # dark purple
set style line  3 lt 1 lc rgb '#550f6d' # dark purple
set style line  4 lt 1 lc rgb '#88226a' # purple
set style line  5 lt 1 lc rgb '#a83655' # red-magenta
set style line  6 lt 1 lc rgb '#e35933' # red
set style line  7 lt 1 lc rgb '#f9950a' # orange
set style line  8 lt 1 lc rgb '#f8c932' # yellow-orange
set style line  9 lt 1 lc rgb '#fcffa4' # light yellow
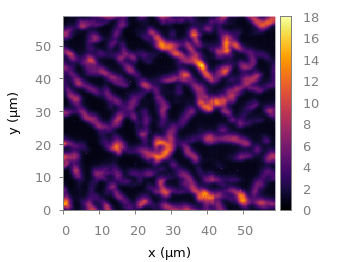
inferno colormap

Fig. 4 Photoluminescence yield plotted with the inferno colormap from Matplotlib (code to produce this figure, inferno.pal, data)
January 8th, 2015 | 9 Comments

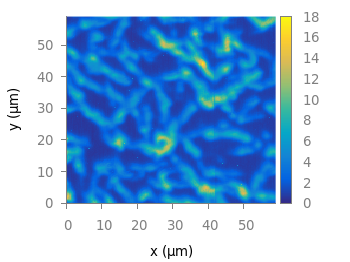
Some time ago I discussed how to get the jet colormap from Matlab in gnuplot. Since Matlab R2014b jet is no longer the default colormap. Now parula is the new default colormap. It was introduced together with new default line colors.

The changes in the default colormap address some of the points that were criticized of jet by Moreland and corrected by his colormap.

Matlab parula colormap

Fig. 1 Photoluminescence yield plotted with the parula colormap from Matlab (code to produce this figure, parula.pal, data)

A colormap similar to the original is stored in the parula.pal file, which is also part of the gnuplot-palettes repository on github. An example application of the colormap is presented in Fig. 1.

In order to apply the colormap you can simply load the file.

load 'parula.pal'

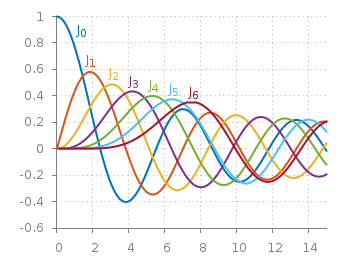
The parula.pal file also includes definitions of line styles. The first line styles (1-9) corresponds to the colors of the parula palette, the line styles 11-17 correspond to the new Matlab line colors, see Fig. 2.

Bessel functions

Fig. 2 Bessel functions from order zero up to six plotted with the new default Matlab line colors. (code to produce this figure, parula.pal, data)

set style line 11 lt 1 lc rgb '#0072bd' # blue
set style line 12 lt 1 lc rgb '#d95319' # orange
set style line 13 lt 1 lc rgb '#edb120' # yellow
set style line 14 lt 1 lc rgb '#7e2f8e' # purple
set style line 15 lt 1 lc rgb '#77ac30' # green
set style line 16 lt 1 lc rgb '#4dbeee' # light-blue
set style line 17 lt 1 lc rgb '#a2142f' # red

If you want to use only the palette and not the line colors, you should remove them from the parula.pal file.

December 18th, 2012 | 48 Comments

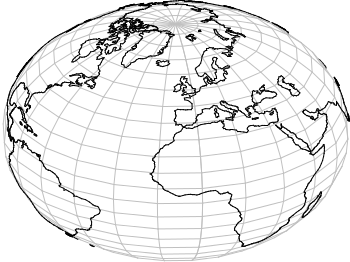
More than a year ago, we draw a map of the world with gnuplot. But it has been pointed out the low resolution of the map data. For example, Denmark is totally missing in the original data file. The good thing is, there is other data available in the web. In this entry we will consider how to use the physical coastline data from http://www.naturalearthdata.com/downloads/ together with gnuplot.

Fig. 1 Plot of the world with the new data file and a resolution of 1:110m (code to produce this figure, data)

At the download page, three different resolutions of the data are available with a scale of 1:10m, 1:50m, or 1:110m. The data itself is stored as shape files on naturalearthdata.com. Hence I wrote a script that converts the data first to a csv file using the ogr2ogr program. Afterwards the data is shaped with sed into the form of the original world.dat file.
Here are the resulting files:

Fig.1 shows the result for a resolution of 1:110m. Note that we have to use linetype instead of linestyle in gnuplot 4.6 in order to set the colors of the grid and coast line.

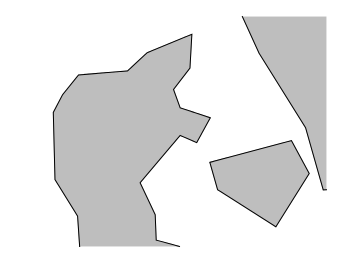
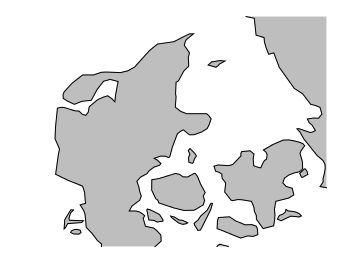
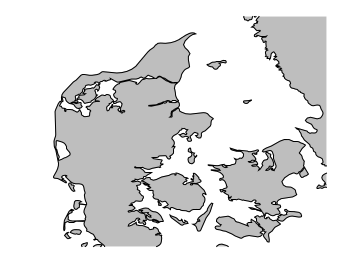
In order to compare the different resolutions of the coast line files, we plot only the part of the map where Denmark is located (which is completely missing in the original data).
Here is the example code for a scale of 1:110m.

set xrange [7.5:13]
set yrange [54.5:58]
plot 'world_110m.txt' with filledcurves ls 1, \
    '' with l ls 2

Fig. 2 A plot of Denmark at a resolution of 1:110m. (code to produce this figure, data)

Fig. 3 A plot of Denmark at a resolution of 1:50m. (code to produce this figure, data)

Fig. 4 A plot of Denmark at a resolution of 1:10m. (code to produce this figure, data)