June 3rd, 2014 | No Comments
Suppose we have a file containing the following data from the plotting data tutorial:
# absolute_data.txt
# X   Y
1   2
2   3
3   2
4   1
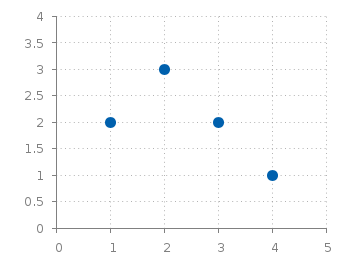
Fig. 1 Plotting absolute data points. (code to produce this figure, data)
This can be plotted in a straightforward manner and will result in Fig. 1. Now suppose we have the same data points stored as relative coordinates in our data file, resulting in:
# relative_data.txt
# deltaX deltaY
1   2
1   1
1   -1
1   -1
If we want to plot that data in gnuplot we have to keep track of the current position manually by storing its (x,y) value as variables by
x=0.; y=0.
plot 'relative_data.txt' u (x=x+$1):(y=y+$2) w p ls 1
Here, we define the starting point to be (0,0) and add to it the values from the first and second column for every line of the data file. By doing so, this results again in Fig. 1. Note, that the addition is always performed first, before the resulting point is plotted which means we get no point at (0,0). Now assume that we also want to add steps going from point to point as shown in Fig. 2. Gnuplot has the steps plotting style to achieve this, but we have to be carefully regarding our (x,y) variables.
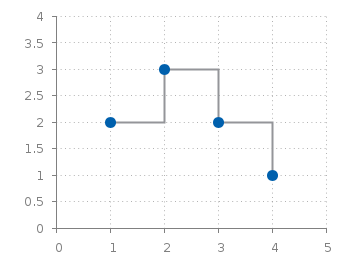
Fig. 2 Plotting relative data points. (code to produce this figure, data)
Every single line of a plotting command is executed after each other which means our (x,y) pair will not be set to (0,0), but to (4,1) at the beginning of the second line of the plotting command. To avoid this we introduce another (a,b) pair for the second line and get finally.
x=0.; y=0.
a=0.; b=0.
plot 'relative_data.txt' u (x=x+$1):(y=y+$2) w steps ls 2,\
     ''                  u (a=a+$1):(b=b+$2) w points ls 1