June 23rd, 2014 | 8 Comments
Occasionally it is a good idea to create a zoom of some part of your main plot, especially if you have a small part of your plot where the data is hiding each other.
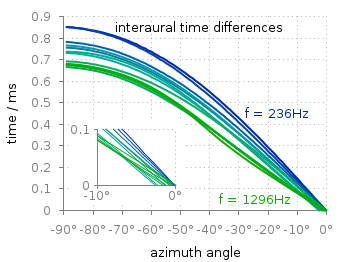
Fig. 1 Including a zoom into your figure to emphasize some data. (code to produce this figure, data)
In Fig. 1 the interaural time difference between a sound signal reaching the two ears of a listener is plotted with different colors for different frequencies. The data is very dense around 0°, so we include a zoom into this region in the same figure at a free place.
This can be done via multiplot and the plotting of the same data in a smaller figure.
set origin 0.12,0.17
set size 0.45,0.4
set xrange [-10:0]
set yrange [0:0.1]
plot for [n=2:13] 'itd.txt' u 1:(column(n)*1000) w lines ls n
The tricky part is that we have a grid in our main figure and if we do nothing the grid will also be visible in the zoomed in version as shown in Fig. 2.
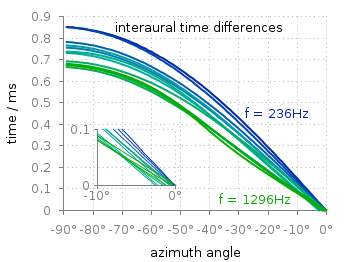
Fig. 2 Including a zoom into your figure, without correcting the grid. (code to produce this figure, data)
To avoid this we have to hide the grid in the background of the zoomed graph. This is done with the trick of placing an empty white rectangle at the place the zoom plot should appear in the figure.
set object 1 rect from -88,0.03 to -49,0.41
set object 1 rect fc rgb 'white' fillstyle solid 0.0 noborder
This will then finally lead to the desired result presented in Fig. 1.
Is there a way to avoid using explicit coordinates for the small plot?
There is no possibility of just saying bottom left. But you can choose how to specify your coordinates. It could be in the values of the axis of your plots, or as I did it by using a global coordinate system going from 0 to 1 in each direction. All possibilities are summarized here: http://www.gnuplotting.org/manpage-gnuplot-4-6/#Q1-1-38
The power of simple things: that is gnuplot.
Excellent!!
Dear Hagen, thanks for these tricks and more generally for this excellent website.
I would like to clarify one thing: it seems impossible to use relative coordinate systems with “set origin” function. Only the “screen” coordinate system will work (by default). Please correct me if I’m wrong. Best Regards.
Hi Alex.
You are completely right, the origin command uses only the screen coordinate system.
Dear Hagen, there is another way to do that without knowing how big the rectangle has to be:
If you want extra space around the new plot then you can change the margins. Regards! :)
Hi dieguico,
this is indeed nice, I didn’t knew the
clearcommand before.The
unset gridpart is not needed and the tricky part is now to find the correct marginsof the small plot. So, I would say in both cases you have to play around a little bit.
For completeness I created Fig. 3 with the code you proposed.
Fig. 3 Including a zoom into your figure to emphasize some data, second method of doing it. (code to produce this figure, data)
I have quite a problem in using this in the epslatex terminal. Apparently the tics of the zoomed in graph are put under the white rectangle, and so they aren’t visible in my Tex document. I have been trying to fix this but I couldn’t find a way. Any suggestion?
Thank you and sorry for my bad English. Awesome site by the way!