May 22nd, 2012 | 3 Comments
In one of the last posts we have looked at how to plot equipotential lines. Here we want to plot the equipotential lines of two sources with different charges, like an electron and a positron.
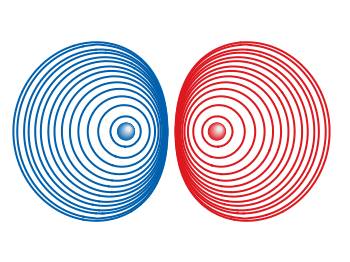
Fig. 1 Equipotential lines of an electron and a positron (code to produce this figure, electron.gnu, positron.gnu)
In addition the sources should be plotted as well, as can be seen in Fig. 1. There the electron is drawn as a red sphere with some lightning effect and the positron as a red sphere. This effect can be achieved with Gnuplot by plotting a bunch of circles with slightly different color and size on top of each other.
set for [n=0:max-1] object n+object_number circle \
    at posx(x,n,max/1.0),posy(y,n,max/1.0) size size(n,max/1.0)
set for [n=0:max-1] object n+object_number \
    fc rgb blue(n,max/1.0) fillstyle solid noborder lw 0
The size and position are determined by the posx,poxy,size functions. The color is chosen according to the blue function for the electron, which is a little tricky and composed of the three color functions r,g,b. These functions generate a color gradient starting from the blue, which is used as the line color for the equipotential lines, into a slight white.
size(x,n) = s*(1-0.8*x/n)
r(x,n) = floor(240.0*x/n)
g(x,n) = floor(144.0*x/n)+96
b(x,n) = floor(67.0*x/n)+173
blue(x,n) = sprintf("#%02X%02X%02X",r(x,n),g(x,n),b(x,n))
posx(X,x,n) = X + 0.03*x/n
posy(Y,x,n) = Y + 0.03*x/n
The code shown so far is put into external functions (electron.gnu, positron.gnu) and can be used in any script to plot equipotential lines, as the one used to generate Fig. 1.
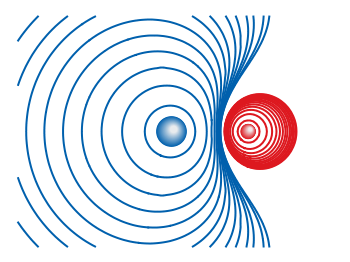
Fig. 2 Equipotential lines of two sources with different charges (code to produce this figure)
The position and size of the source are the parameters of the functions. Fig. 2 shows the result for a negative particle with twice the absolute charge of the positive charged particle.
# positron
x1 = 2; y1 = 1; q1 = 1
# electron
x2 = 1; y2 = 1; q2 = -2
call 'positron.gnu' x1 y1 '0.1'
call 'electron.gnu' x2 y2 '0.2'
Thanks to Gnuplotter for the original idea.
Thank you very much for this article, it has been very useful for me. Nevertheless, using Gnuplot 4.6 over AquaTerm, the border of the circles appeared, so that I had to add the ‘noborder’ modifier which specifies that no bounding lines are drawn:
set for [n=0:max-1] object n+object_number circle \
at posx(x,n,max/1.0),posy(y,n,max/1.0) size size(n,max/1.0)
set for [n=0:max-1] object n+object_number \
fc rgb star(n,max/1.0) fillstyle solid noborder lw 0
Sorry for a new comment. When creating successive electrons, positrons, or so on, the last of the circles is ‘overwritten’ by the next object. This is difficult to notice if the ‘max’ variable is high enough as in the examples, but if it is low enough you can see the loose of one circle per object. To avoid this, the ending of ‘electron.gnu’ and ‘positron.gnu’ could be rewritten as:
# Set new object and label number
object_number = object_number+max
label_number = label_number+1
In addition, with this change, if you need to clear all this objects but not others, you can write:
gnuplot> unset for [n=object_number-1:1:-1] object n
gnuplot> unset for [n=label_number-1:1:-1] label n
gnuplot> object_number=1; label_number=1
And replot conveniently. Thanks!
Thanks for your comments, I have changed the text and the code accordingly in order to fix this.