November 29th, 2011 | 3 Comments
A spectrogram is a time-frequency representation that shows how the spectral content of a signal varies with time. In Fig. 1 the spectrogram of the German sentence “Achte auf die Autos” is shown.
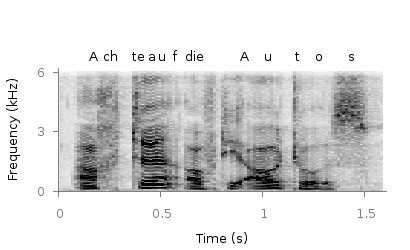
Fig. 1 Spectrogram plotted with plot (code to produce this figure, data)
The spectrogram is plotted as mentioned in the color maps entry.
plot 'spec.dat' binary matrix with image
In addition the letters were putted on the graph at their corresponding time of occurrence. The letters itself and their positions are stored in the two lists syl and xpos. In order to access the single entries of these lists within a for loop the function word is needed.
# Adding the syllables
syl  = 'A    ch   te   a    u    f    d    ie   A    u    t    \
o    s   '
xpos = '0.15 0.22 0.36 0.44 0.49 0.56 0.62 0.66 0.89 1.01 1.16 \
1.26 1.42'
set for [n=1:words(syl)] label word(syl,n) at word(xpos,n),6800
Another way to plot the spectrogram is by using splot which will result in a different kind of smoothing algorithm of the spectrogram, as can be seen in Fig. 2.
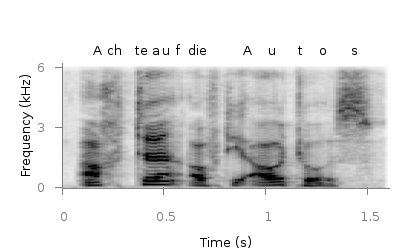
Fig. 2 Spectrogram plotted with splot (code to produce this figure, data)
But to get this result we have to fix some of the margins, because plot is two-dimensinal and splot is three-dimensional which is not desired here.
set border 10 front ls 11
set tmargin at screen 0.75
set bmargin at screen 0.25
set rmargin at screen 0.95
set lmargin at screen 0.15
Hi,
this is great stuff! Would you mind to explain to me, how you generated the spectrogram data? I need to do something similar and am really stuck here… Thank you!
Best Regards,
Patrick
You can use the specgram function in Matlab/Octave (in octave you need the signal package from octave-forge). The graph above was created with:
sig = wavread('sentence.wav');
[s,f,t] = specgram(sig,512,44100,1024,400);
%# Use only until 6000 Hz
s = abs(s(1:141,:)).^(1/4);
f = f(1:141);
In order to plot it with gnuplot you have to store the data first, that can be done by this script.
If you want to do more fancy stuff with spectrograms you may have a look at the audspecgram function of the Auditory Modelling Toolbox.
Oh man! This absolutely saves my day and weekend! The procedure about how to get it right is excellent. It all explains what I got when I tried to play those parameters around! Thank you so much!